
Silk is a beautiful website building platform for people who want to create and manage a specialized database online. Now, it’s rolling out a new ‘Explore’ page format so that visitors can easily search and filter the information that they’ve published online.
When you hit the Explore tab on the homepage of any website built using Silk, you’ll see the new design shown below. By selecting the Filter button at the top, you can start setting new filters based on the categories, fields or values that the creator has defined for each entry in their directory.
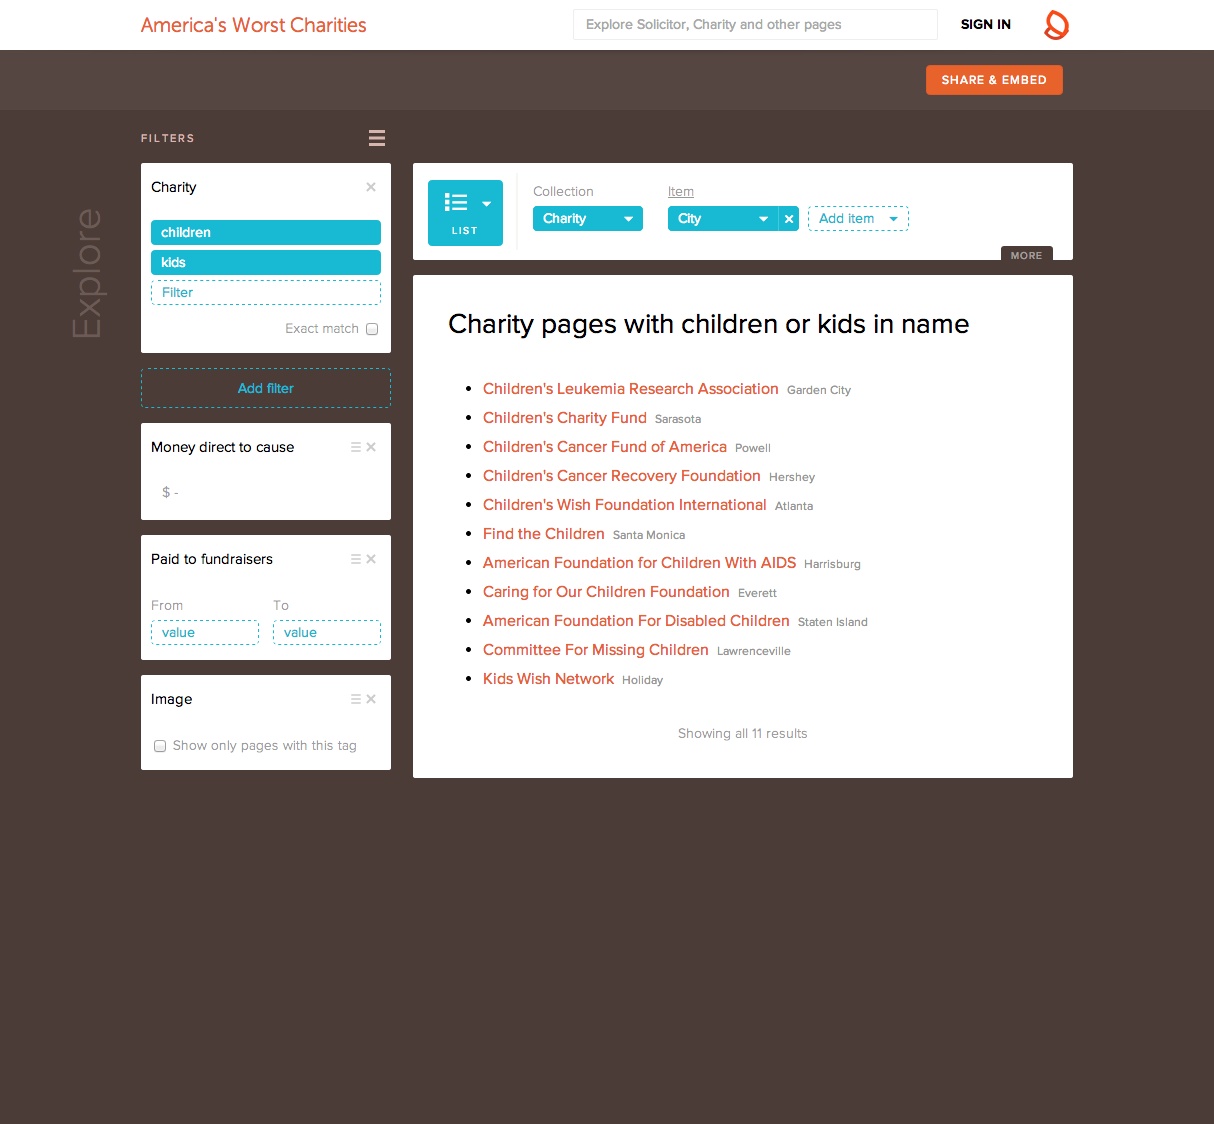
For instance, this site tracks charities in the US with bad financial habits, and its filters include the amount paid both to the charity and the cause it supports, the year it was formed and the amount raised to date by fundraisers. Results are then shown in the middle of the page and you can set whether you want them to be visualized as a table, map, list, grid, or pie/column/line chart.

Silk won the startup competition at The Next Web Conference 2011 in Amsterdam for its originality and ease of use. Whether you want to help people find the best coffee shops in New York, or rank the best 3D printers currently on the market, Silk excels at storing and visualizing that data, as well as making it easy for anyone to request and find specific information.
More: Atomico-backed Silk launches smart search, data visualization tool in open beta / Filter and Visualize Data in Seconds with Silk
➤ Silk (Via Blog Post)
Get the TNW newsletter
Get the most important tech news in your inbox each week.