
From the founders of Xtify, later acquired by IBM, and MeetMoi, subsequently snapped up by Match.com, comes Indicative, a company that’s setting out to build “the next generation of web and mobile analytics.”
The New York-based startup is officially launching its core product out of beta today, after a spell in private beta. In a nutshell, Indicative is a browser-based platform aimed specifically at marketers and product managers, and is looking to bring a visual, intuitive, easy-to-use platform to non-technical users.
How it looks
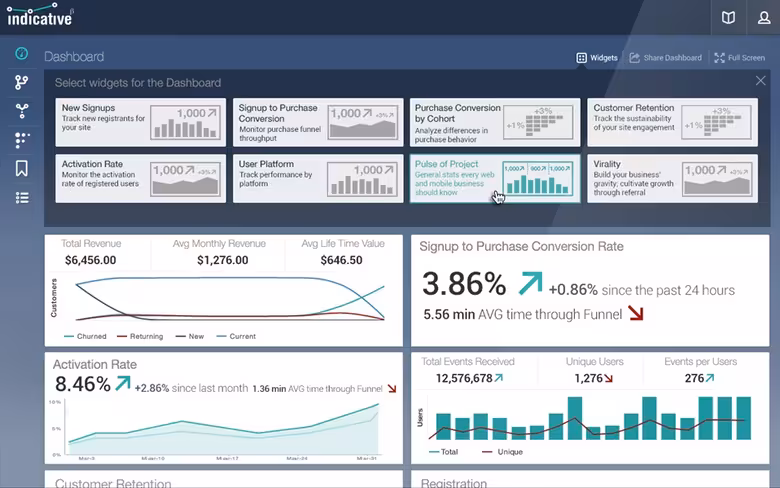
Indicative lets you select from a number of widgets to include in the main dashboard, which will obviously vary based on your own requirements. So things like ‘Signup to Purchase Conversion’ or ‘Virality’ could be options for different companies.
But perhaps the key selling point of Indicative is the level to which it lets you create personalized views of your data, drilling down into the nitty-gritty.
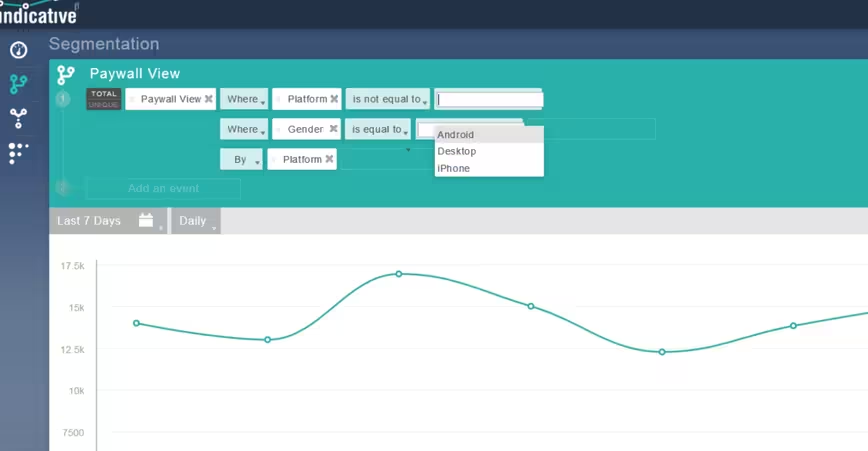
The drag-and-drop interface lets you pull ‘Events’ in to the main canvas area to kick things off, for example ‘Paywalls’ (if that’s relevant to your company).
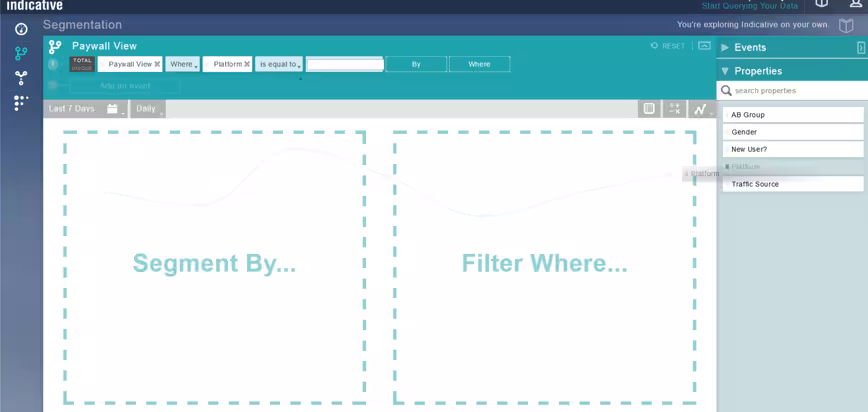
Against this, you could peg Properties such as ‘Platform’ and ‘Gender’, and configure the data that’s displayed accordingly.
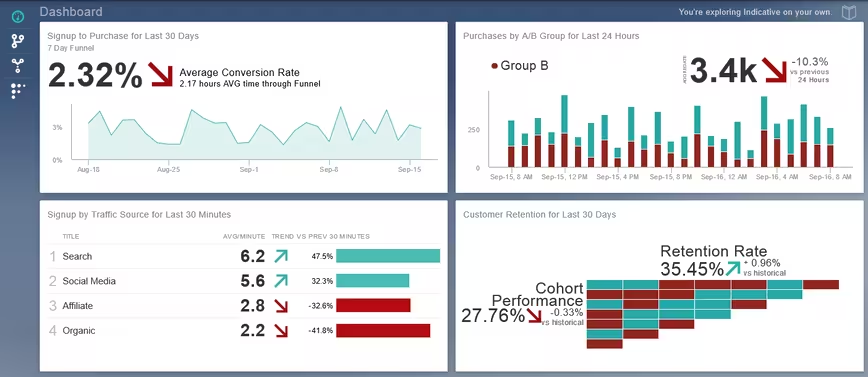
Armed with your desired metrics, Indicative lets you view real-time activity from across your various platforms. This includes things like tracking behavior (including drop-off points) with a view towards increasing conversion and maximizing retention.
It also lets you view and compare consumer behavior over a specific period of time, so you can look back and analyze how key events impacted traffic.
The core raison d’être of Indicative is to help ensure that “data science isn’t just for statisticians,” as the company puts it. We played around with a demo of the service, and it’s certainly sophisticated and fairly granular, with a few clicks and drags helping you build your dashboard and dig down into some useful data.
“While the act of starting a business may be an art form, iterating on a product and marketing campaigns can be made into a science if businesses have access to data that illustrates how they are performing,” explains Jeremy Levy, CEO and co-founder. “Indicative captures that data, synthesizes it, and then presents it to users through tools that make it easy to interpret and optimize their businesses in real-time.”
In terms of pricing, the free tier covers you for up to 10,000 monthly users with unlimited ‘events’, then it’s $79 per month for up to 50,000 users and $79 for each additional 50,000. This also delivers additional features, such as a user analysis tool, revenue-tracking and more.
For unlimited everything plus a handful more features, and access to Indicative’s Marketing ROI Optimizer, you’ll need to call for customized pricing.
The company says that it plans to “aggressively” build out its platform over the next twelve months and beyond, throwing new tools into the mix.
Feature Image Credit – Shutterstock
Get the TNW newsletter
Get the most important tech news in your inbox each week.