The concept of visualizing data has caught a lot of eyes in recent years, especially the fitness sector. Simply considering the amount of popularity that revolved around Jawbone’s Up (despite the fact that the product didn’t work), shows the potential of recording and visualizing activities.
What’s most impressive is that many of the opportunities related to data visualization have yet to be realized, but don’t worry, the open source community is on it.
AntiMap, an open source creative toolset for tracking and visualizing your own data, is out to make it easy to record information with your smartphone, and is creating some awesome ways of turning that information into something useful. The team’s goal is to produce new and creative representations of data, and the project currently consists of an Android and iPhone app to record information, along with Web and desktop applications that interpret it.
Record your data
 AntiMap Log is a DIY solution for gathering real-time stats with your phone while you’re out snowboarding, skiing, mountain biking, driving, running, or whatever your into.
The application uses GPS and compass sensors to extract and store the following information: latitude, longitude, compass direction, speed, distance and time.
It was created using Processing for Android and openFrameworks for iOS, and the source code is available in case anyone is interested in playing with it!
Analyze and visualize
After your data is indexed, it can then be used in conjunction with free AntiMap analysis applications (or your own creations) to visualize your every move. So far the team has two apps available:
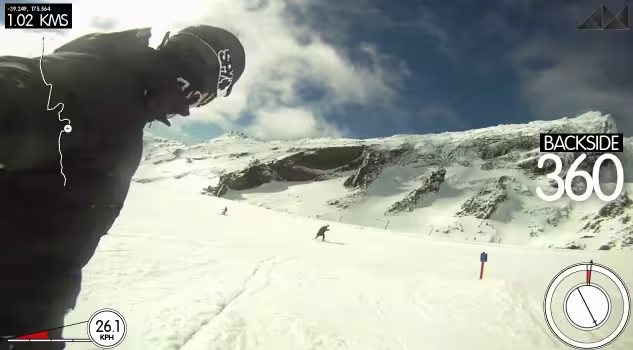
#1. AntiMap Video is a desktop application built-in Openframeworks. It synchronizes recorded data from the AntiMap Log mobile application with raw video footage. It was originally created as a snowboarding/skiing application to visualise real-time rider data and stats similar to a video game (check out the video above for more!).
#2. AntiMap Simple is a HTML5/ProcessingJS demo that visualises data from the AntiMap Log mobile application. Circles are used to visualise the plotted data. The color of each circle correlates the compass data, and the size of each circle correlates to speed (bigger circles = faster).
According to the team, further applications and source code will be released in the coming months, in hope that users can learn from and find interesting ways to visualise data and use their technology. But what will be most exciting is the creative uses outside developers will think up as AntiMap’s data tracking methods become more sophisticated.
What if the app is able to integrated with other data sets, like Face.com‘s API? What if it plugged into weather patterns or air quality via extensions like Citizen Sensor?
The point is that there is so much potential good for these sort of applications as they become more sophisticated. They can help us become healthier, and have the power to reveal things we might have never known about ourselves, like specific habits, tastes and larger trends with the overall population.
What do you think will be the future for data tracking?

Get the TNW newsletter
Get the most important tech news in your inbox each week.