
If you are the owner of a website, there are probably only a few things that please you as much as seeing your site’s traffic spike after you’ve published a really great post or released a new product.
You probably already use Google’s free Analytics tool to keep track of every drop and spike in traffic. With the help of the apps mentioned here, you can take your obsession on the go while your iPhone keeps you up to date about the goings-on on your website at any given time.
Analytics App ($6.99)
This app is the absolute antithesis of every other in this list. Whereas the others focus on great design and a minimalistic presentation of features, Analytics App insists on cramming every single statistical detail it can into its confines – and it spares only a casual thought for the UI while at it. Clearly, functionality is in the lead here, with form bringing up the rear—but is that really a bad thing?

The 💜 of EU tech
The latest rumblings from the EU tech scene, a story from our wise ol' founder Boris, and some questionable AI art. It's free, every week, in your inbox. Sign up now!
Analytics App supports multiple websites, so all the websites added to your Google Analytics account show up in it. When you select one, you are presented with a whole array of reports, divvied up into categories such as overview, visitor, traffic, content, e-commerce, site search and goals. The entire list of available reports runs for several pages, with basically no end in sight.
Each report—whether it be visitor recency or network location, visitor’s city or their OS version—can be tapped on to bring up a display of its associated statistics. A couple of tabs at the bottom of this screen allow you to view them in absolute numbers or by percentages. A set of options lets you customise the amount of time the reports are generated for.
The overview reports have graphs and pie charts along with the tables of numbers and you can tap on them to view them in fullscreen. For the most part, the app looks and behaves the same in both landscape and portrait modes.
Overall, the app has essentially every analytics feature you could imagine, and if that floats your boat, perhaps its relatively high price tag won’t seem so much to you. If your website is your primary revenue earner, I can see how you might want all this data. I, however, see little use for this much detail about website statistics and am definitely not a fan of this app’s interface. If you are anything like me, check out one of the other apps in this list.
Analytiks ($0.99)
Taking the simple and social approach, Analytiks puts your visitor stats on a well-designed grungy background and offers you a congratulatory word when you have a good day and words of encouragement when the traffic is down. Compared to some of the other apps in this list, the number of stats it displays is positively anaemic, but that’s the beauty of the app.
It’s USP is its focus on the social: it displays what percentage of your site’s visitors made their way to it from Facebook or Twitter, and from Bing, Google or Yahoo! search results. It displays the stats for that day, with a comparison against how you did on the day before, and for that month, with a similar comparison to the month before.
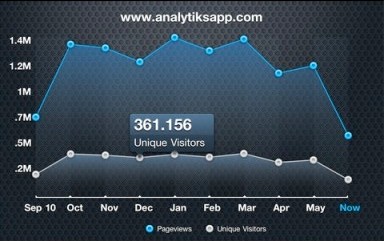
If you rotate the phone into landscape mode, you are presented with a beautifully done graph, with page views and unique visitors mapped onto it for the duration of the past year. Tapping on any point on the map shows you the number of page views or unique visitors for that month in absolute terms.
It also supports multiple websites, so you can add all the websites you want to track to a single Google Analytics account and Analytiks will let you keep an eye on them all. Overall, with its well-designed UI and some unique features, the app gives you solid bang for your buck.
Ego ($1.99) / Ego for iPad ($2.99)
Among the apps in this comparison, Ego is a bit of a standout because, besides Google Analytics, it can fetch your stats from a whole host of other services such as Ember, FeedBurner, Mint, Squarespace, Tumblr, Twitter and Vimeo (with Flickr and other services to come in the future). It is also very well-designed, making it a pleasure to launch the app to take a glance at your stats.
A glance is just what you are going to get though, because Ego does not delve deep into your statistics to fetch you detailed charts and lists of statistics. Instead, it requires you to add widgets to its dashboard, each one displaying the stats for one account on any one of the services mentioned above.
Once you add your Google Analytics account to it, you can tap on the widget to cycle through your daily, monthly and yearly page views and visits. Similarly, the Twitter widget lets you keep track of your followers, the number of people you are following and the total number of tweets you have posted. The Mint widget keeps track of your website statistics much in the same way as Google Analytics, and so on and so forth.

On the iPad, the sidebar on the left presents you with the same list of widgets as its iPhone counterpart, but swiping on any of them just launches that website in a Web view on the right. This is a significant disappointment; I would have expected the app to make use of all that real estate to fetch and display more in-depth data about any particular widget, specially given that it requires a separate, more expensive purchase than the iPhone version.
The idea with Ego is to launch the app and get a look at the most important stats across all your services at one go, and this it does with aplomb. If that sort of overview-only approach floats your boat and you use a couple or more of these services, Ego is a perfectly good app to spend $2 on. But I’d steer clear of the iPad version if I were you.
Quicklytics ($1.99)
Whereas the other apps in this list are all about minimalism (with one exception) and insist on keeping the informational content low, Quicklytics is all about packing as many stats onto that 3.5-inch (or 9.7-inch) screen as it can; and the best part is that it does it all without sacrificing on style.
Quicklytics is a universal app, so a single app gives you both an iPad and an iPhone version. The design is minimal and beautiful, but is packed to the gills with features behind the hood. The app’s main interface is divided into four tabs, allowing you to see the stats for that day, the day before, the current month and a custom period of time according to your own setting. The whole thing can be slid over to switch to your other sites as well.
The main screen is dominated by a main graph at the top and three smaller ones below for the number of visits, page views or pages visited by a user per visit, and another one for the bounce rate. When you tap on any of the smaller graphs, it replaces the large one at the top.
Tap on the graph at the top and it brings up a list of with every single stat imaginable. Divided under Visitors, Sources, Content, Goals and Commerce categories, you can see everything from the operating systems used by your visitors to their countries, the referring sites, top landing and exit pages, search keywords, and pretty much everything else under the sun.
The developers have really gone to great lengths to add depth to this app and it shows in the final product. Both the iPad and iPhone counterparts share a similar design and have the same features. Available for just $2 on the App Store, if you are a serious statistics junkie, this is the app for you. It’s also the one that, in my opinion, is the best of this bunch.
Get the TNW newsletter
Get the most important tech news in your inbox each week.