Activity Monitor for Mac
Activity Monitor is a little know gem of an app hidden in the Utilities folder in your Applications folder. It can look daunting when you first launch it but once you look past the information overload and find out what to focus on it can become an invaluable tool.
![]() Find yourself staring at a spinning beach-ball cursor regularly? Do you hear your computers fan start up regularly? Are some apps slower than usual? Activity Monitor will tell you why and help you fix problems.
Find yourself staring at a spinning beach-ball cursor regularly? Do you hear your computers fan start up regularly? Are some apps slower than usual? Activity Monitor will tell you why and help you fix problems.
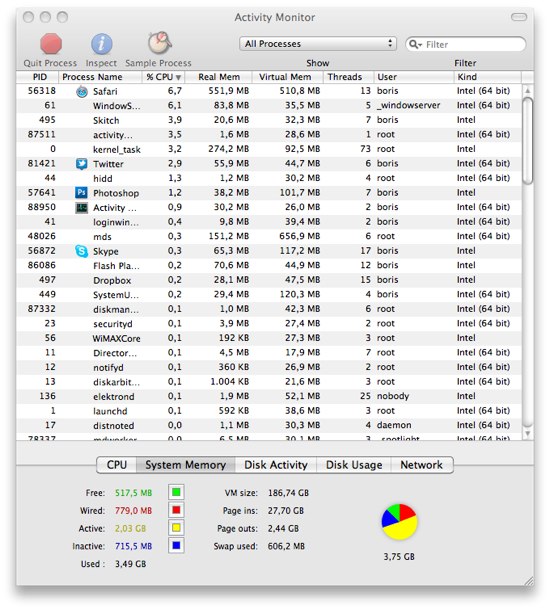
When you first start Activity Monitor it will show you the System Memory tab:
The long list of names in Activity Monitor contains all the processes running on your computer. These are not just the Applications you’ve launched but also all the background processes needed to run your computer and Mac OS X.

As soon as you see an application persistently using a large percentage of your CPU you should ask yourself if you really need to have it open and then consider closing it.
You might not recognize all the running processes and blindly closing them is never a good idea and can lead to crashes and data loss. What I usually do when I see a process using a lot of CPU is Google its name. That is how I found out that Spotlight was trying to index my Time Machine disk with a process called “mds” that claimed 80% of my CPU every time Time Machine started backing up. I excluded my Time Machine disk from Spotlight and my MacBook Pro became responsive again during back-ups.
The next thing you can do is order these processes by ‘Real Mem” and “Virtual mem”. If you haven’t guessed it yet “Mem” stand for “Memory” and these tabs show you how much memory is being used by your applications.
If Mac OS X runs out of real memory it uses Virtual memory, or a piece of the slower harddisk instead of your faster RAM chips. It is an elegant but slow solution. If your computer is using a lot of Virtual Memory you might want to consider closing down some apps or even upgrading to more RAM.
Below the processes are some live updating memory stats that could be interesting. This is what they all mean:
Free memory
This is RAM that’s not being used.
Wired memory
Information in this memory can’t be moved to the hard disk, so it must stay in RAM. The amount of Wired memory depends on the applications you are using.
Active memory
This information is currently in memory, and has been recently used.
Inactive memory
This information in memory is not actively being used, but was recently used.
For example, if you’ve been using Mail and then quit it, the RAM that Mail was using is marked as Inactive memory. This Inactive memory is available for use by another application, just like Free memory. However, if you open Mail before its Inactive memory is used by a different application, Mail will open quicker because its Inactive memory is converted to Active memory, instead of loading Mail from the slower hard disk.
Used
This is the total amount of memory used.
VM size
This is the total amount of Virtual Memory for all processes on your Mac.
Page ins / Page outs
This refers to the amount of information moved between RAM and the hard disk. This number is a cumulative amount of data that Mac OS X has moved between RAM and disk space.
Tip: Page outs occur when your Mac has to write information from RAM to the hard drive (because RAM is full). Adding more RAM may reduce page outs.
Swap used
This is the amount of information copied to the swap file on your hard drive.
Conclusion
Activity Monitor can help you analyze your computer usage and fix problems. Make a habit out of starting it up whenever you see the Spinning Beach-ball or when your computer feels slower than usual.
Get the TNW newsletter
Get the most important tech news in your inbox each week.

