No self-respecting audio enthusiast takes ‘smart’ speakers seriously. The Amazon Echoes and Google Homes of the world are, after all, primarily designed to get you hooked on their respective voice assistants. That they happen to be able to play some tunes is little more than the means to that goal.
At least, that’s my cynical predisposition. I hope you can forgive me for being a little jaded about Google’s new Nest Audio — what I thought was simply another smart speaker destined to collect dust on a dresser. Audio is something I care deeply about, and I regularly review multi-thousand dollar speakers here at TNW. Not to say good speakers need be expensive, but the big G isn’t exactly one of the first companies I think about when it comes to sound quality.
After spending some time with the Nest Audio, I think that’s about to change — and I’ve got the data to show you why.

The <3 of EU tech
The latest rumblings from the EU tech scene, a story from our wise ol' founder Boris, and some questionable AI art. It's free, every week, in your inbox. Sign up now!
See, something caught my attention during Google’s Pixel 5 event and a separate briefing with journalists soon after. Google didn’t just bore us with the usual marketing spiel about how the Nest Audio would let you hear music “as the artist intended” — sighs — but it also talked about some of the science behind the Nest Audio’s improvements.
While the original Google Home was primarily tuned through intuition — a surefire way to make mediocre speakers — the Nest Audio was tuned through research, according to Product Manager Chris Chan.
The briefing was simplified for mainstream audiences, sure, but mentions of double-blind testing, maximizing dynamics, thermal dissipation, dispersion characteristics, waveguides, and internal cabinet volume reminded me more of a hi-fi briefing than something I expected for a $99 smart speaker.
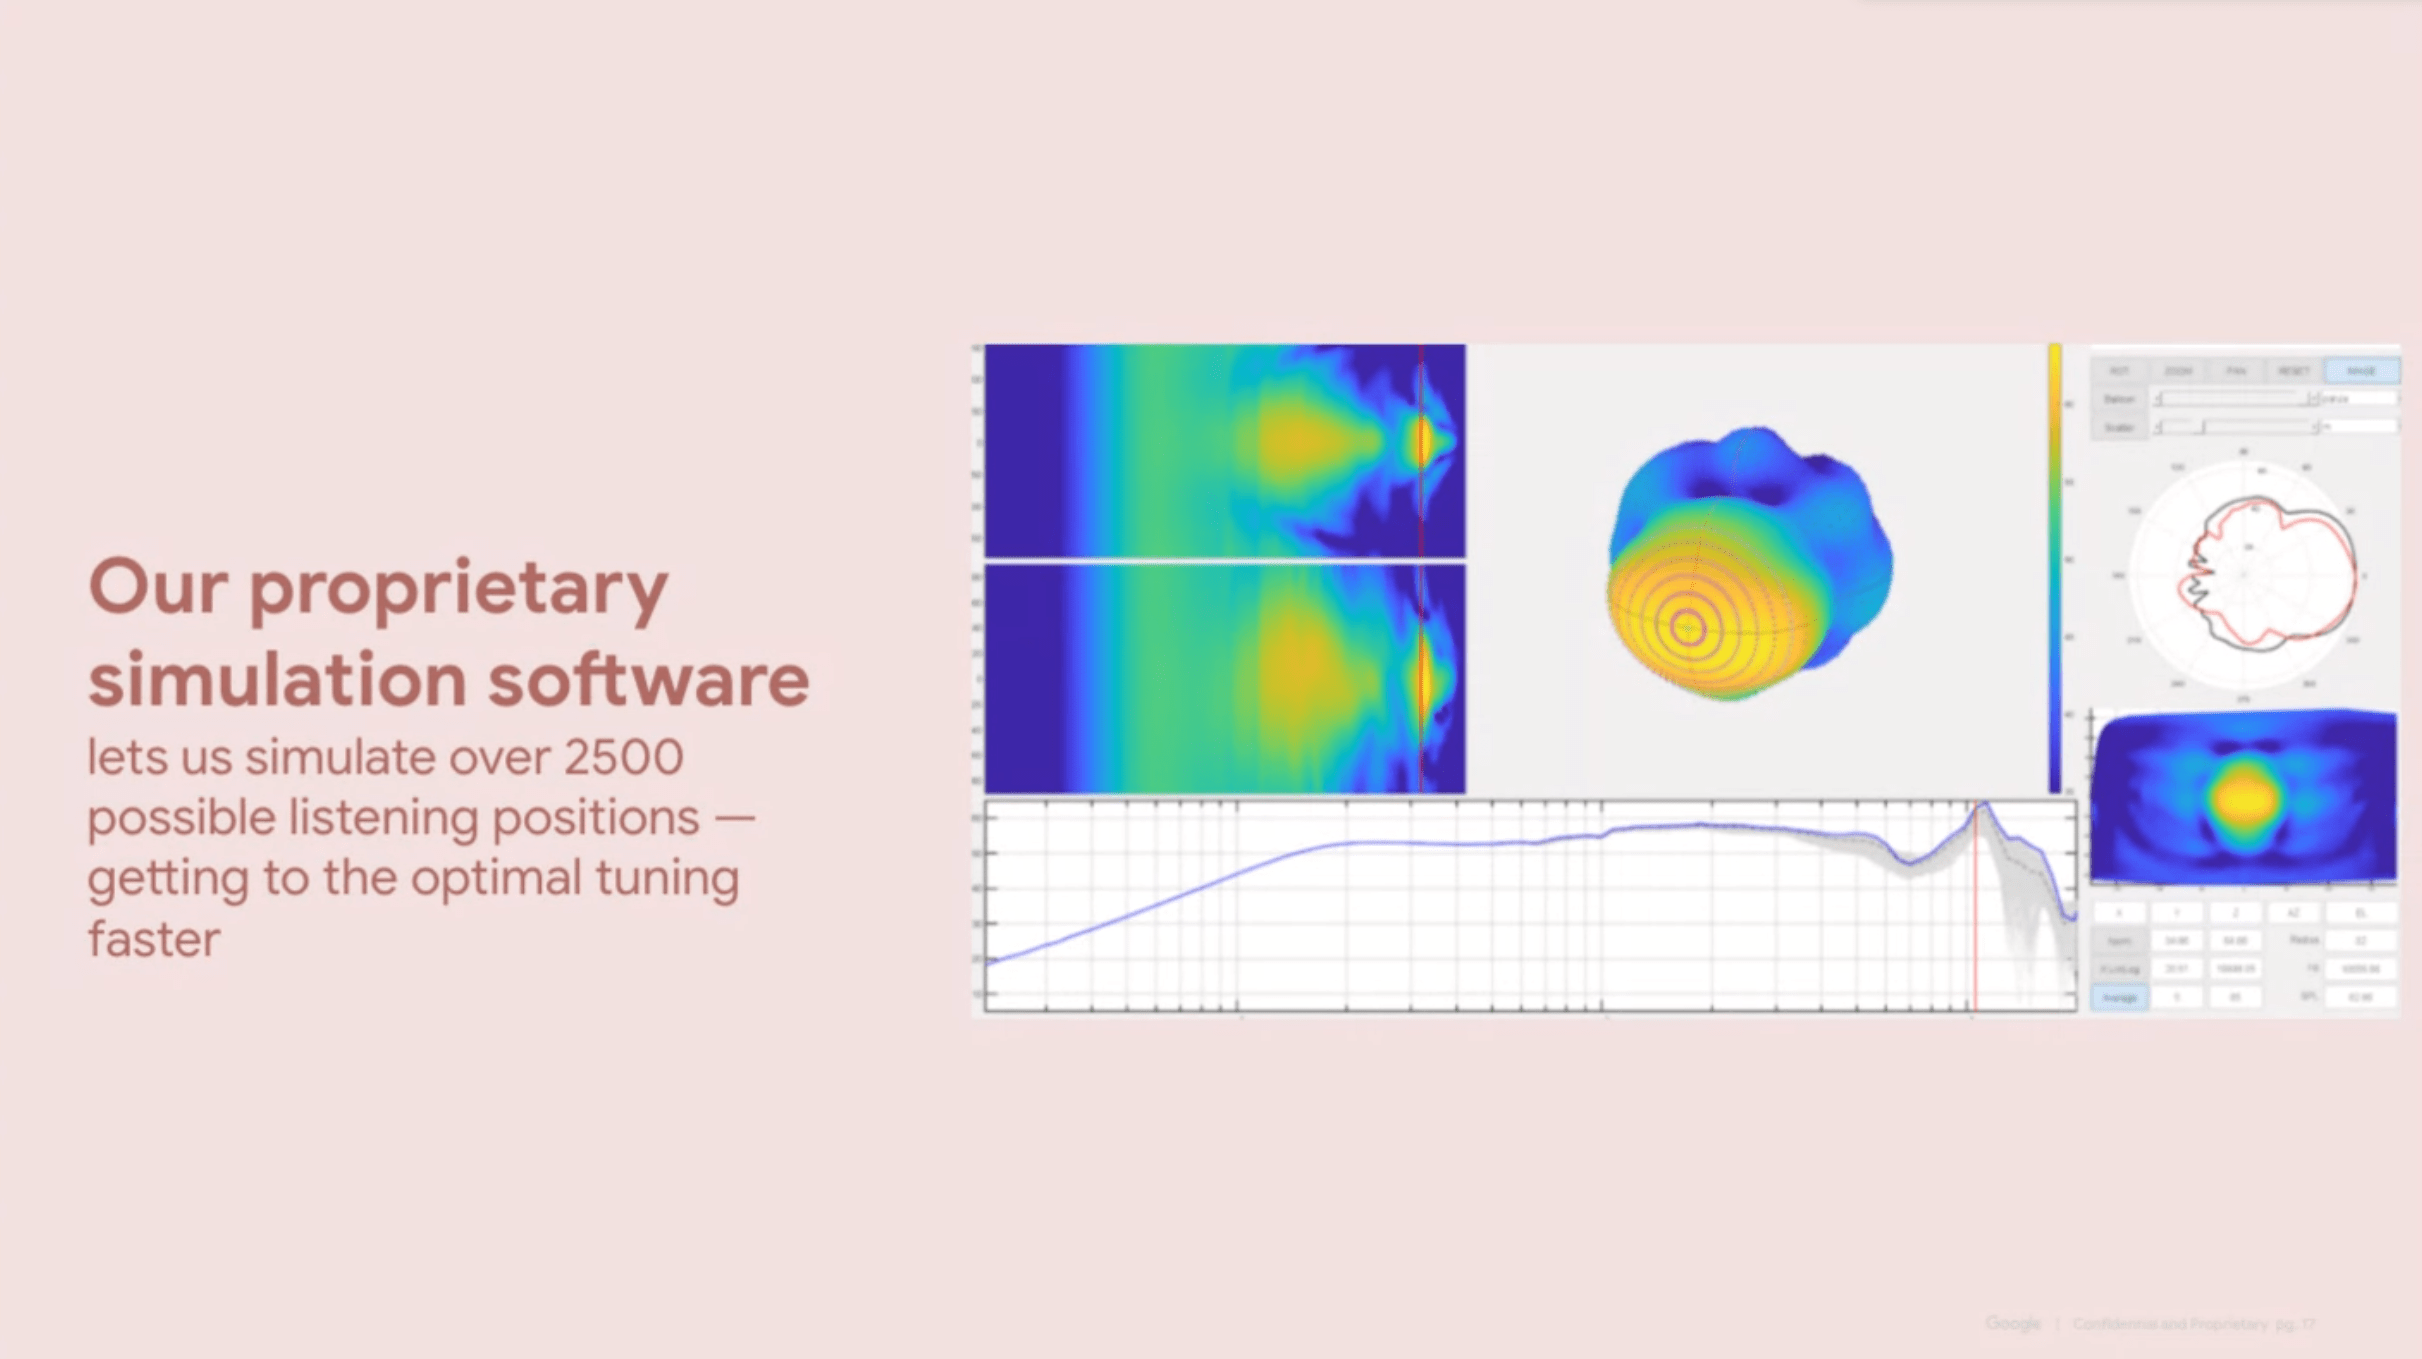
Chan even says Google developed its own speaker software that allows it to simulate the speaker’s sound at 2,500 listening positions.
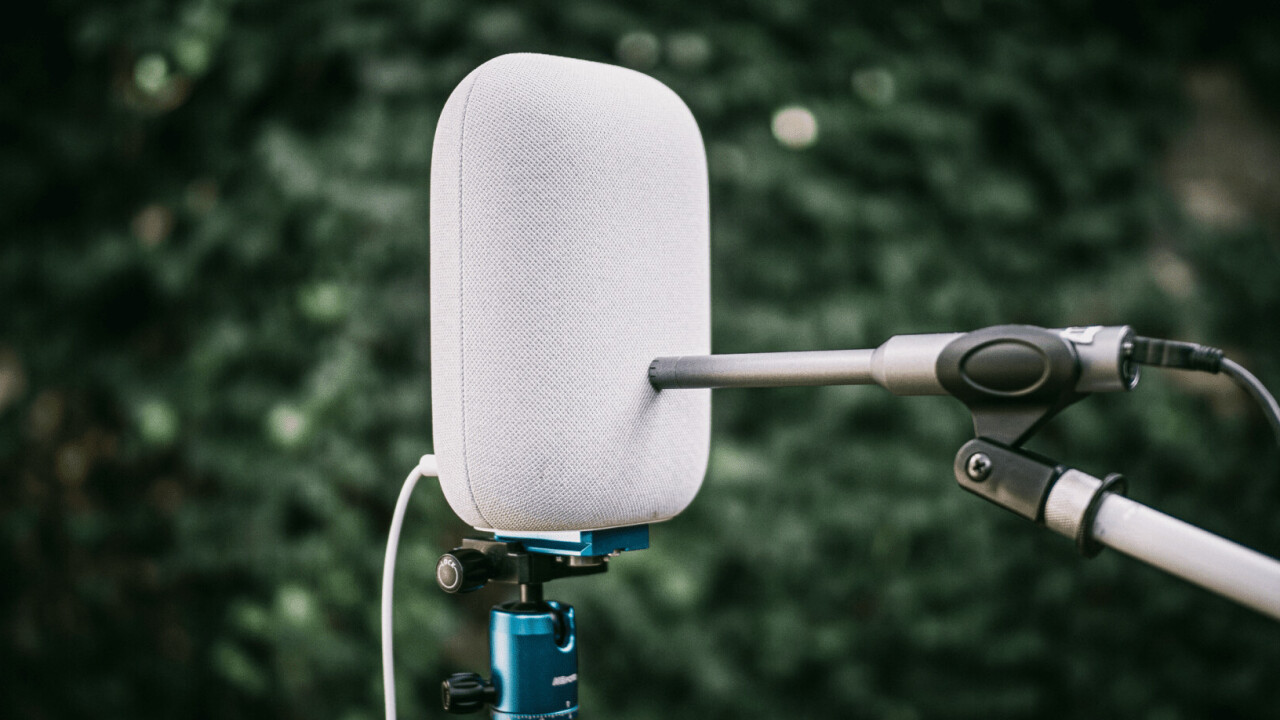
So when I received my Nest Audio for review, I decided I would treat it like any other of my other hi-fi reviews: I was going to science it.
The Basics
Fair warning: this review will get technical, so if you’re not interested in the data behind a good speaker, there will surely be a multitude of other reviews you can choose from. I’m not going to spend much time on features and the like beyond what I wrote on announcement day.
I do have some quick impressions to share though. The Nest Audio is a cute little speaker meant to replace the Google Home before it. It obviously supports the Google Assistant and Chromecast, and it can also play audio via Bluetooth as well.
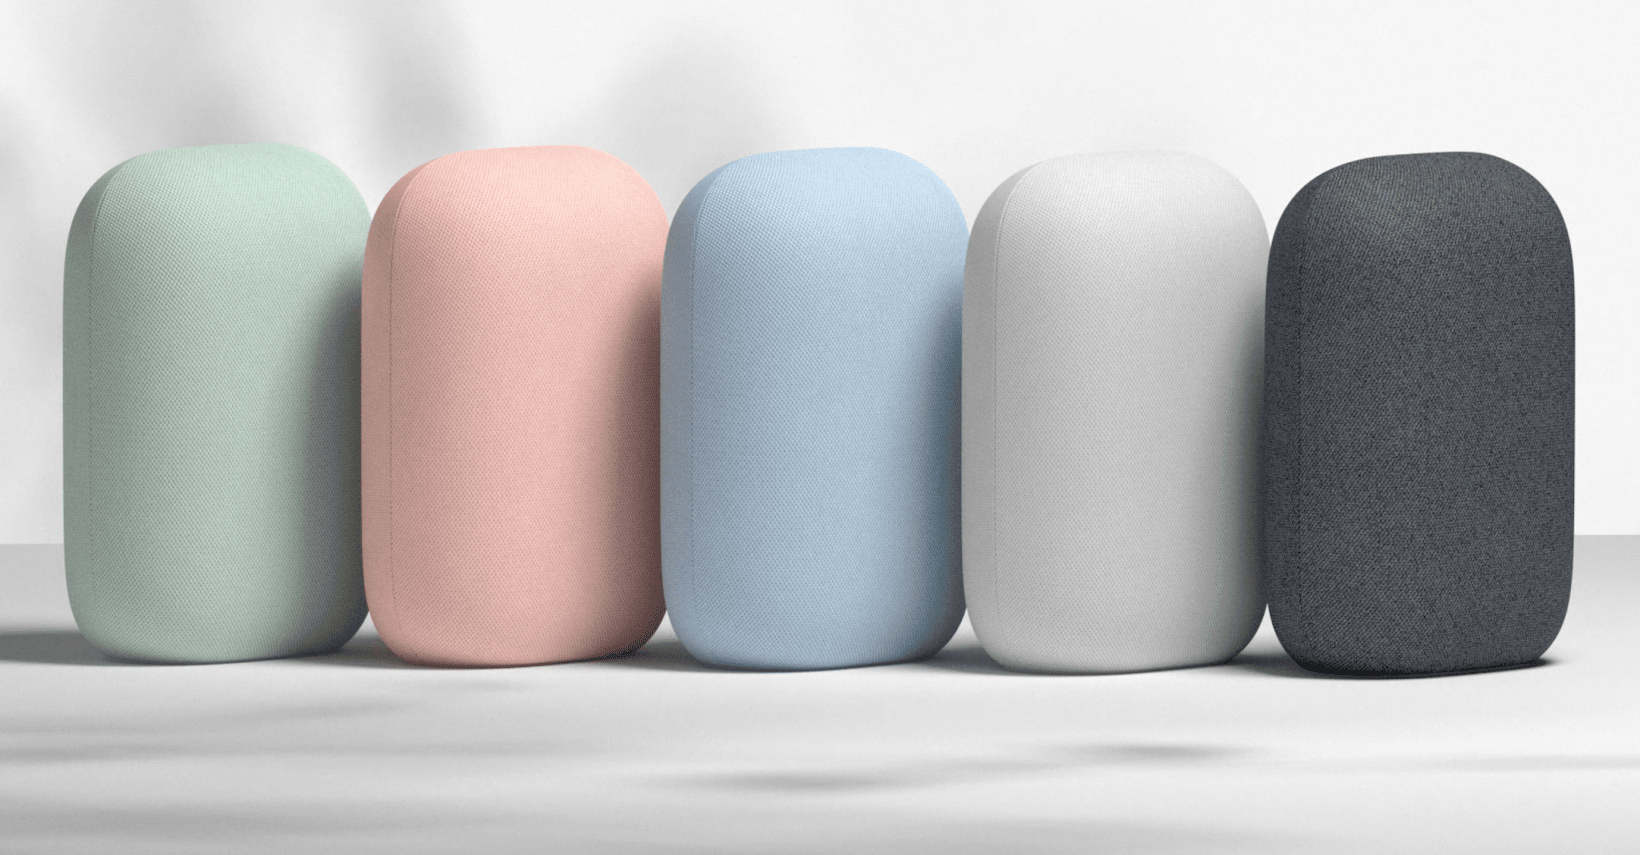
It’s smaller than I expected from photos, about the size of a paperback book. The fabric wrap looks classy, and though I wish Google had sent me one of the more colorful finishes, the Nest Audio appears to be decidedly inoffensive to most decor.
Using it is a cinch. Setup takes only a minute or two via the Google Home app. It responds rapidly to most basic voice commands thanks to local processing with a special machine learning chip. Volume and playback can be controlled via three hidden touch areas at the top of the speaker. You can connect it with another Nest Audio to create a stereo pair (it works for both Bluetooth and Chromecast), although I only received one unit for review.
The Nest Audio can automatically EQ itself and raise volume depending on ambient noise and the content that’s playing. Google says it leaves music untouched, which I appreciate, but it was pretty cool to see how the speaker could raise its volume when I turned on a faucet in the kitchen.
And oh yeah, the Nest Audio sounds really good. It’s not boomy or tizzy. It is, to my very pleasant surprise, resoundingly neutral, although you do have access to bass and treble sliders in the Google Home app. It won’t get crazy loud, but within its decibel limitations, it sounds seriously good for $99 a pop.
The measurements will show us just how good.
What I’m looking for:
As far as I’m concerned, there are two primary requirements for good sound:
- A relatively flat anechoic frequency response. In speakers, this is perceived as neutral, which studies show usually equates to ‘good.’
- Smooth dispersion characteristics. This means that as you move off-axis (away from the front and center of the speakers), the sound changes smoothly. This translates to a good soundstage, as these sounds eventually get reflected back to your listening position, which your brain interprets as a sense of space.
These characteristics have repeatedly been shown to correlate highly with listener preferences in double-blind tests — usually more than other aspects of sound reproduction like distortion. This is how measurements become useful: Not only is a roughly flat frequency response truer to the input signal, it also happens that it tends to be preferred by listeners.
As Chan said Google had used double-blind testing in creating the Nest Audio, I hoped to see these two characteristics present. During his briefing, Chan shared a couple of slides showing off how these tests were used to assess sound quality preferences, giving listeners the option to describe what they just heard with a software survey:
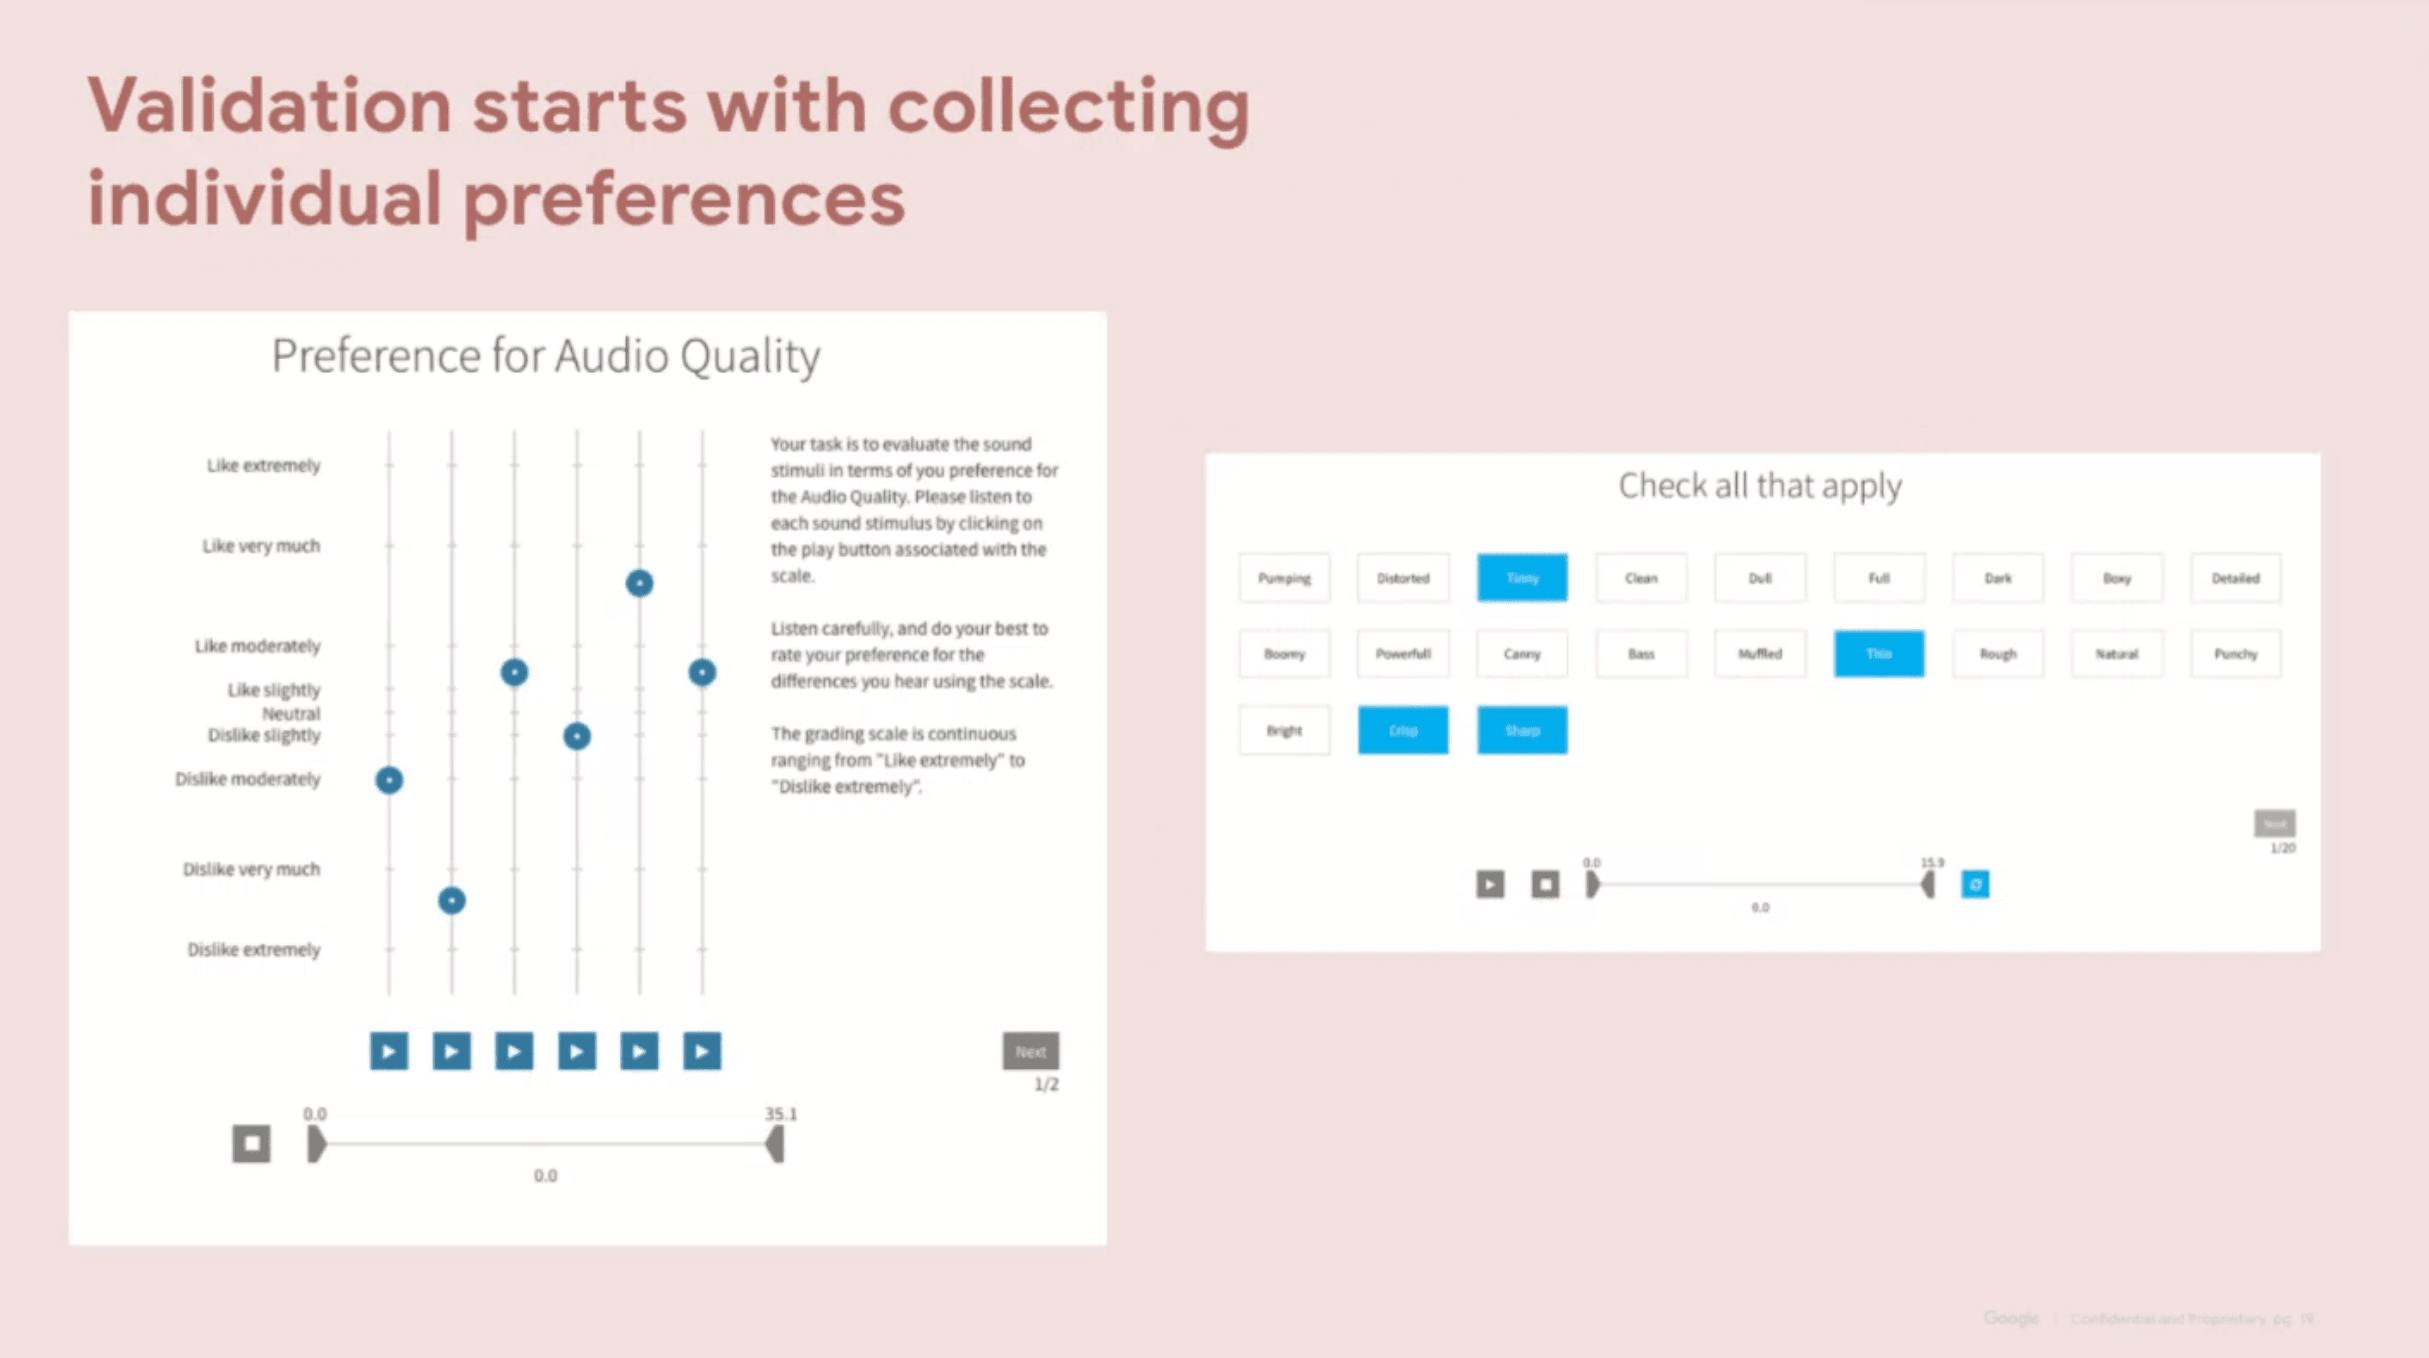
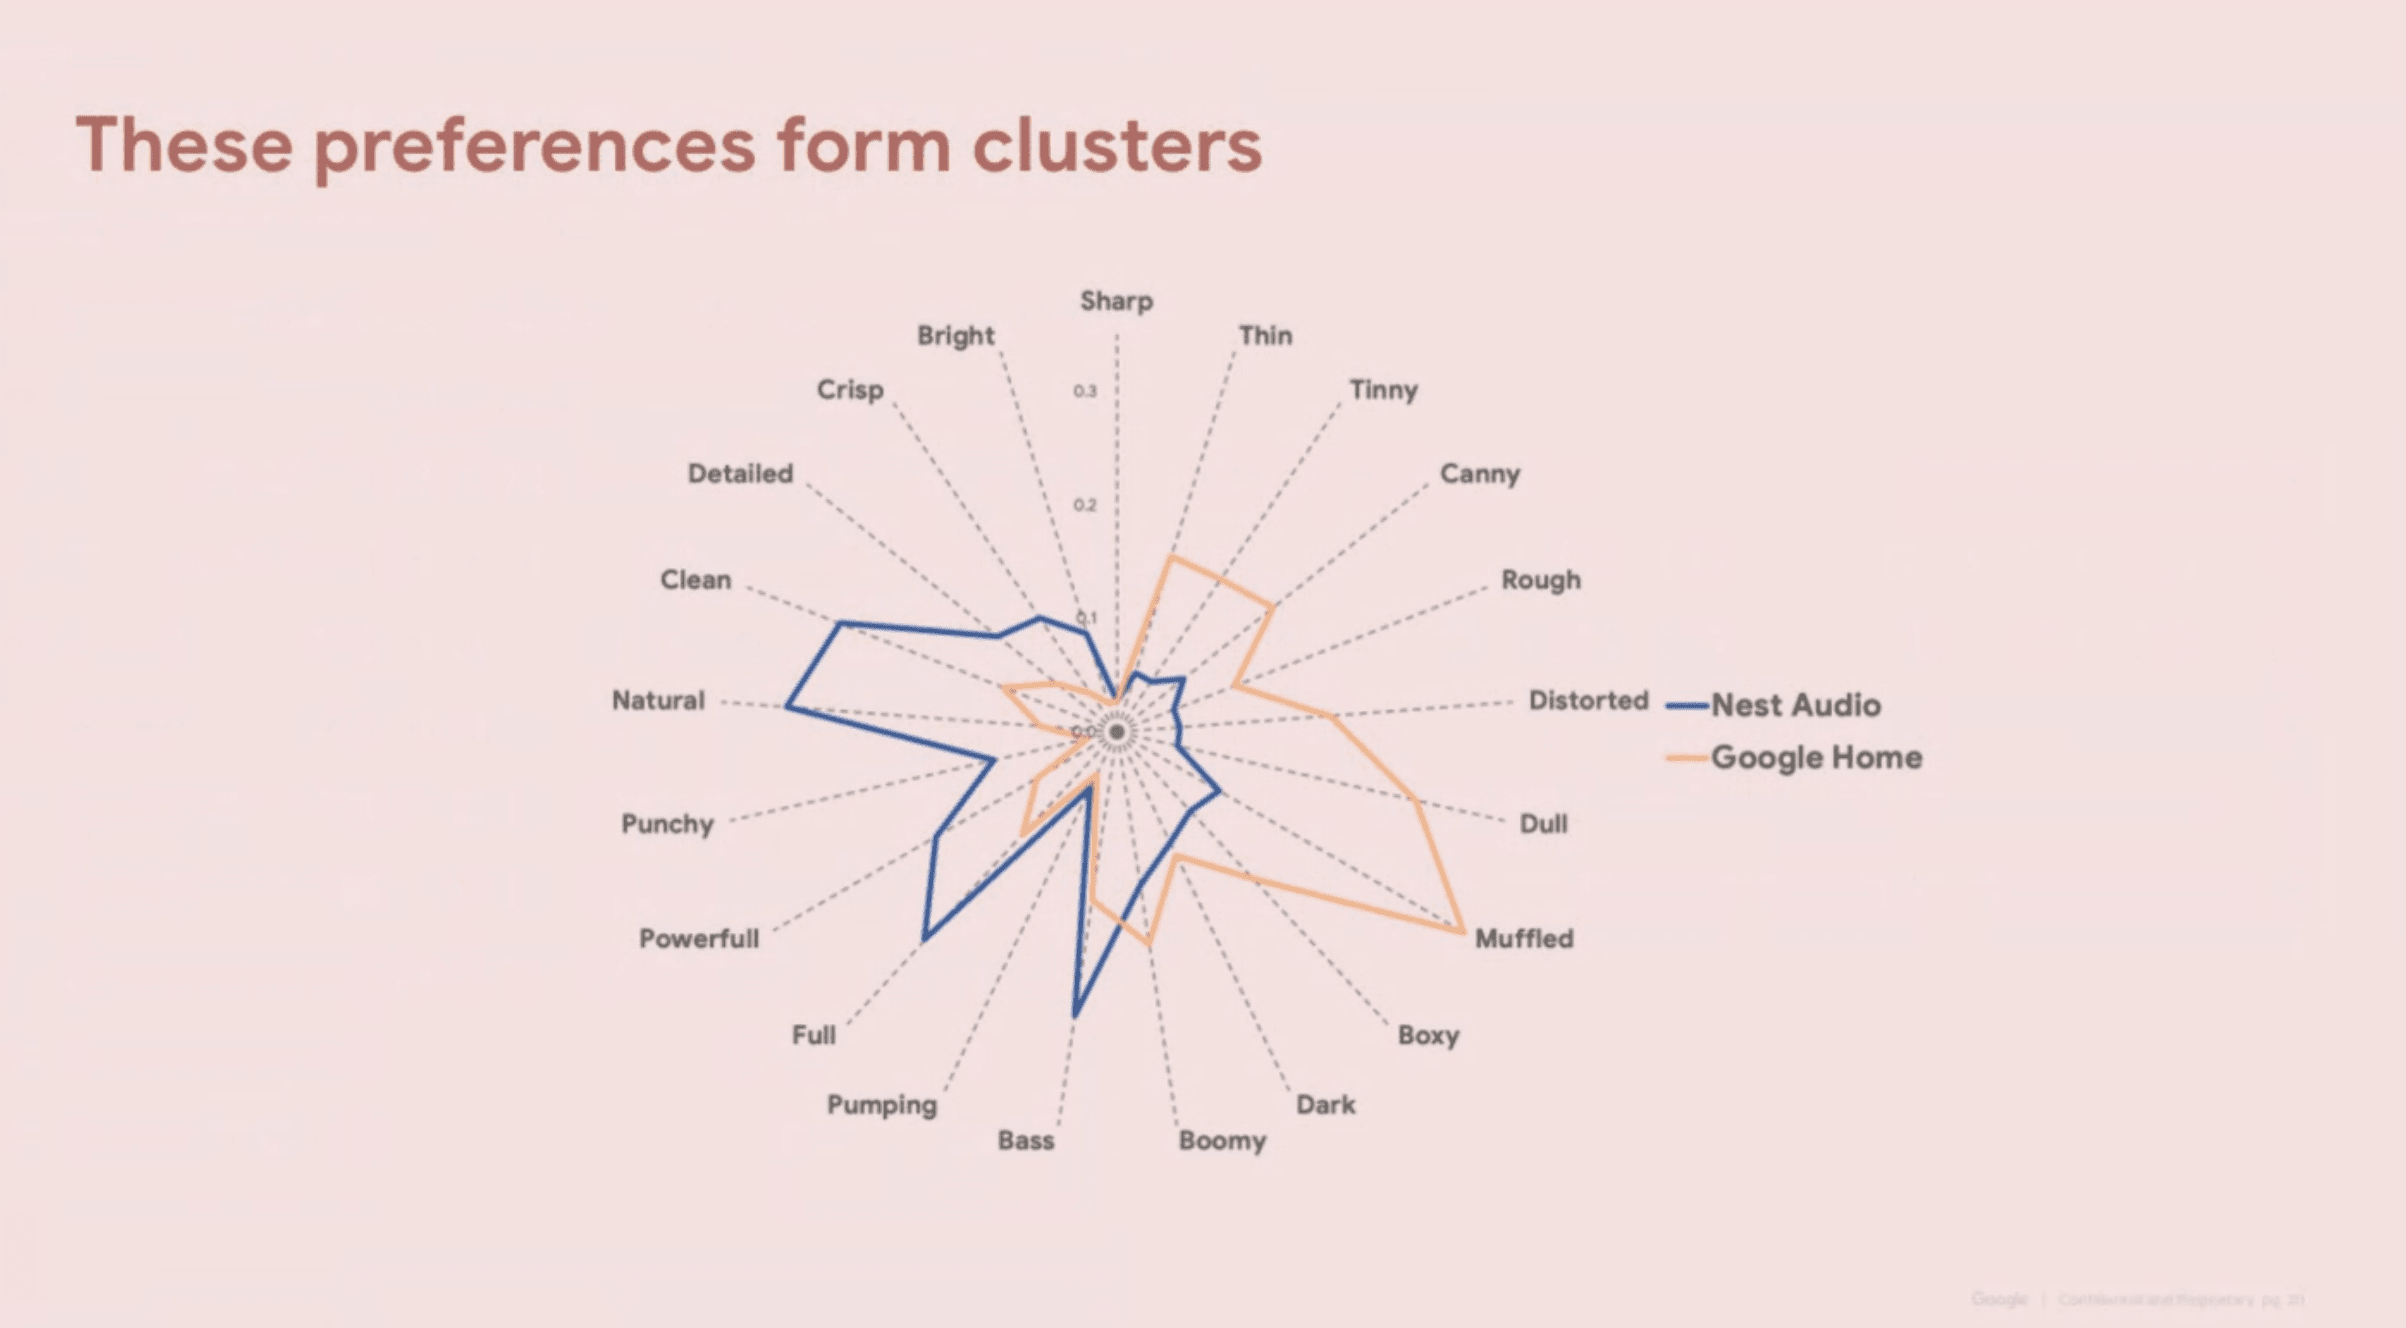
Current science on double-blind speaker preferences tells us this should lead to the aforementioned measurement qualities.
How I measure
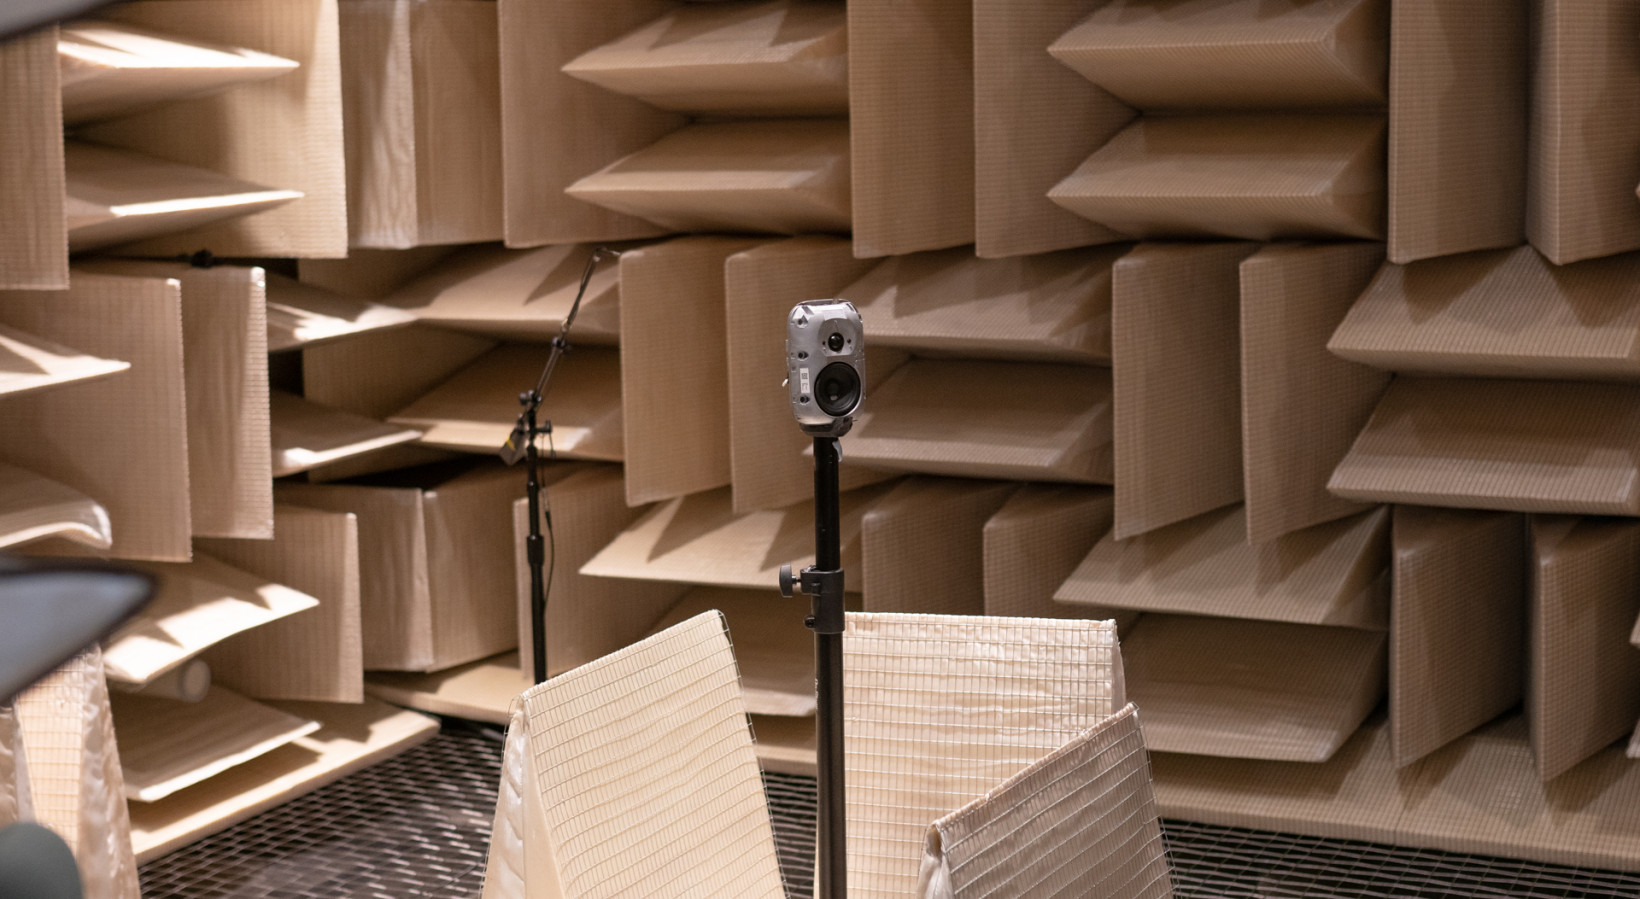
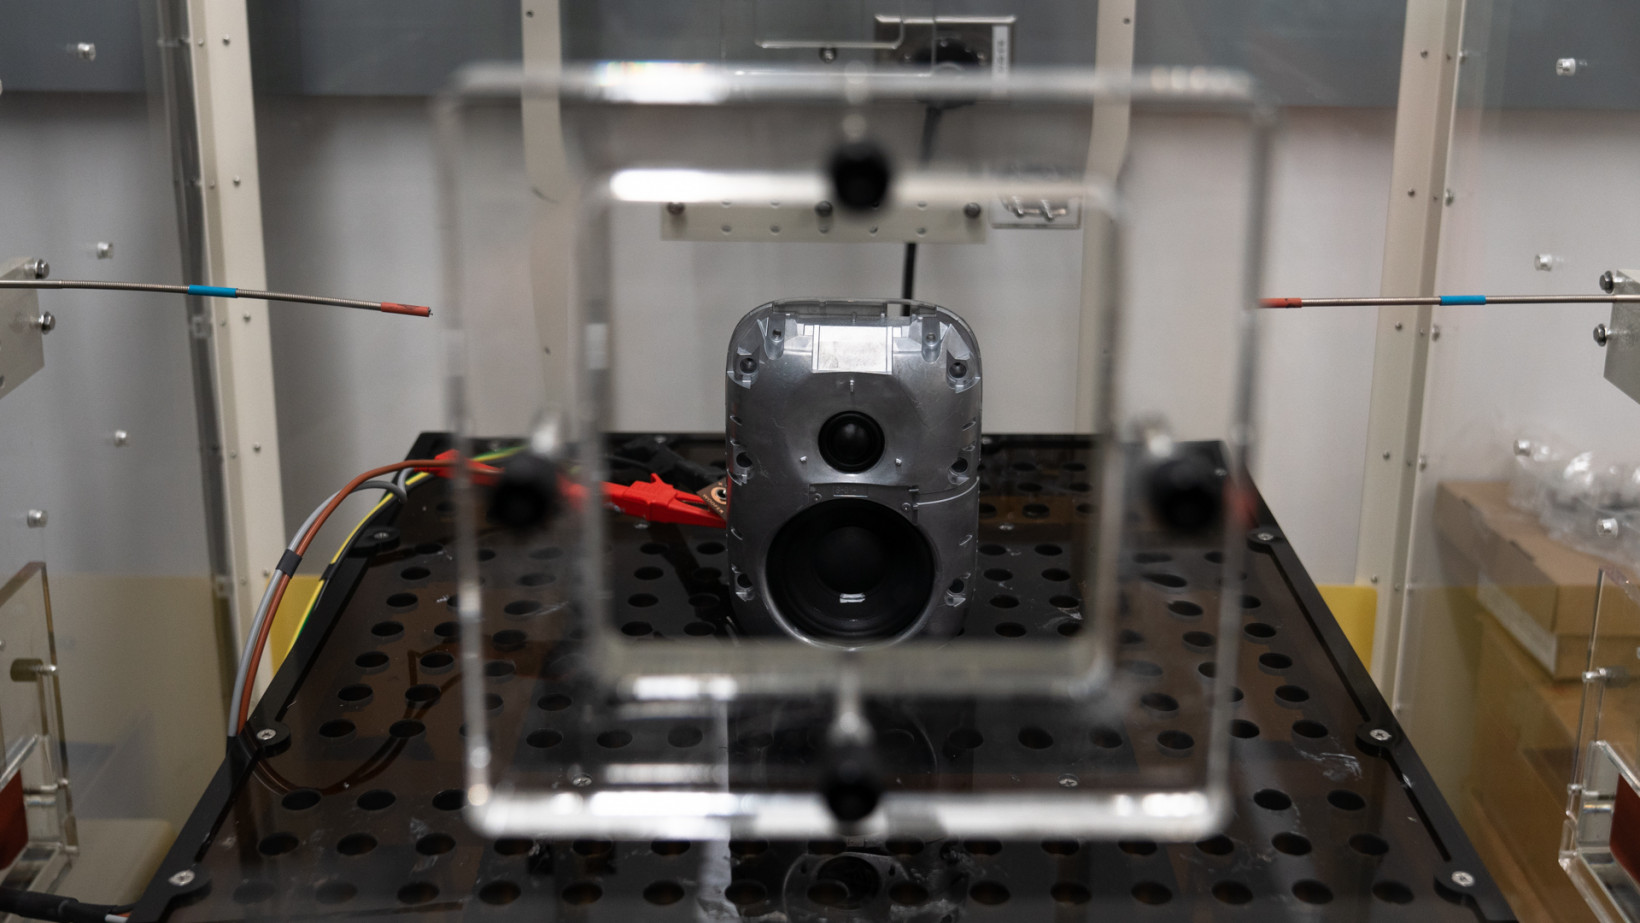
In order to perform useful speaker measurements, we need to minimize the influence of room reflections that will mask the true frequency response. High-end audio companies generally do this by measuring speakers in an anechoic chamber. I can’t fit one of those in my Brooklyn apartment, but I did just move to a place with a backyard, which helps; the farther I am from walls, the closer I can replicate an anechoic result.
I can then take measurements in software like Room EQ Wizard and, using a technique called impulse response gating or time-windowing, essentially ‘see’ when the first major reflection arrives at the microphone, usually a few milliseconds after the initial signal. I then set my ‘window’ to only include the data up to right before this reflection hits, and the reflections are effectively removed from the final frequency response.
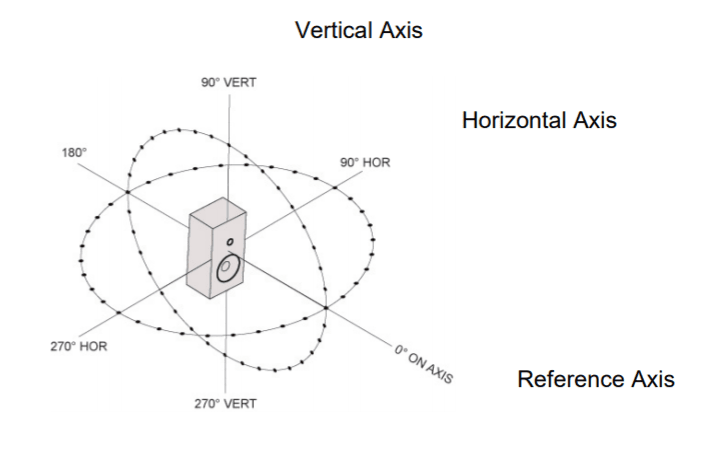
Oh yeah, I also capture the data at 70 different angles to accurately characterize a speaker’s dispersion characteristics (as established by the CTA-2034A measurement standard). Yes, it is tedious, and I may or may not have dropped the speaker a couple of times during the process (don’t worry, the measurements didn’t change).
Unfortunately, this technique becomes ineffective at the lowest frequencies, but I can get around this by measuring extremely close to the woofer and using software to merge this data with the farfield measurements.
While this isn’t a perfect replacement for an anechoic chamber, one can get pretty darn close to the real thing. Close enough, at least, to tell the good speakers from the bad.
The data
Once I collect data for those 70 angles, I can generate a graph called a ‘spinorama,’ so-called because of all the times one spins the speaker while capturing data along its horizontal and vertical axes.
The spinorama distills these 70 angles into one simple graph, giving us a useful summary of both the speaker‘s direct sound and how it radiates sound into a room. Research has shown the data in the spinorama to be good enough to predict user preference with as much as 86 percent accuracy. At the very least, this single graph is usually enough to separate the good speakers from the bad ones.
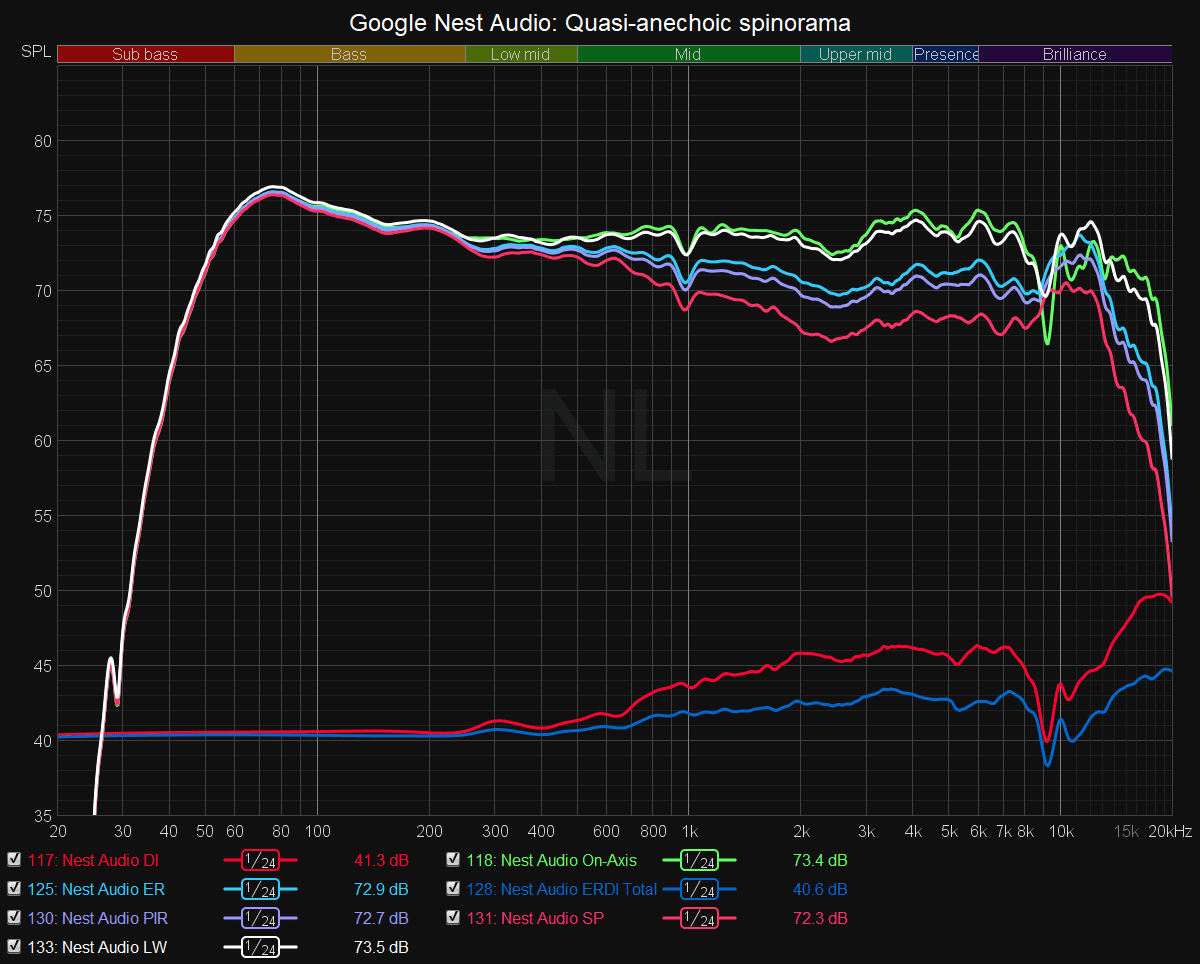
This is decidedly a good one. Frankly, it’d be a good spinorama for a speaker at most price points, but it’s especially good for a speaker costing $99 apiece. It’s even more impressive so when you consider all the other stuff Google has to stuff into the speaker to make it ‘smart’.
I realize the above lines may just look like rainbow spaghetti to some readers. Explanations of how to interpret these lines are provided over at Speaker Data 2034 and Audioholics. In the interest of not making this review too unwieldy, I will focus on just a few of these:
- The On-Axis (green) and Listening Window (white) curves represent the ‘direct’ sound of the speaker before any reflections, and they should be relatively flat. The Listening Window is an average of the nine angles within ±30 degrees horizontal and ±10 degrees vertical to account for the fact most people don’t sit perfectly-centered in front of a speaker, so it is usually the more useful of the two.
- The rest of the curves focus more on the off-axis sound — the sound that will reflect off your walls. The Early Reflections (blue) is particularly important, as it estimates the very first bounces off your walls, floor, and ceiling. These reflections contribute significantly to our impressions of both tonal balance and soundstage. As such, we generally want the Early Reflections curve to roughly maintain the shape of the Listening Window (it will usually tilt down a few dB; this is fine). The Early Reflections curve being similar to the Listening Window is a reliable predictor of a good soundstage due to similarity between the direct sound and reflected sound.
If you haven’t dozed off yet, we can see why the Nest Audio is so impressive. Until 8 kHz or so, it is quite flat in the listening window. To put this in context, I’ve seen worse from speakers over 50 times the price. The frequency response here indicates a speaker that is mostly neutral in tonality — balanced in its representation of different parts of the frequency range. This is good: it makes for a speaker that doesn’t significantly overemphasize any part of the sound and just sounds ‘right.’
For comparison, here’s a $400 pair of speakers I recently reviewed:
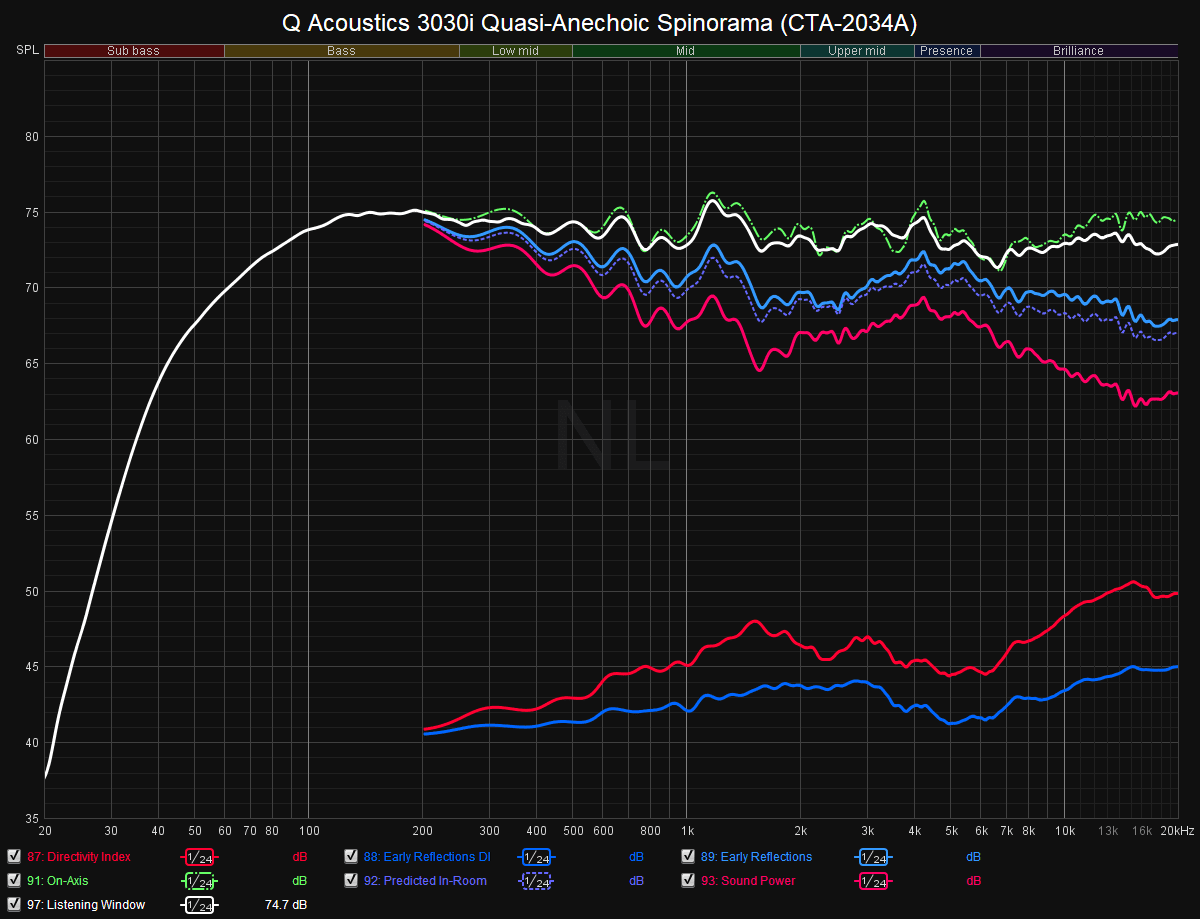
And here’s a $1,600 speaker pair:
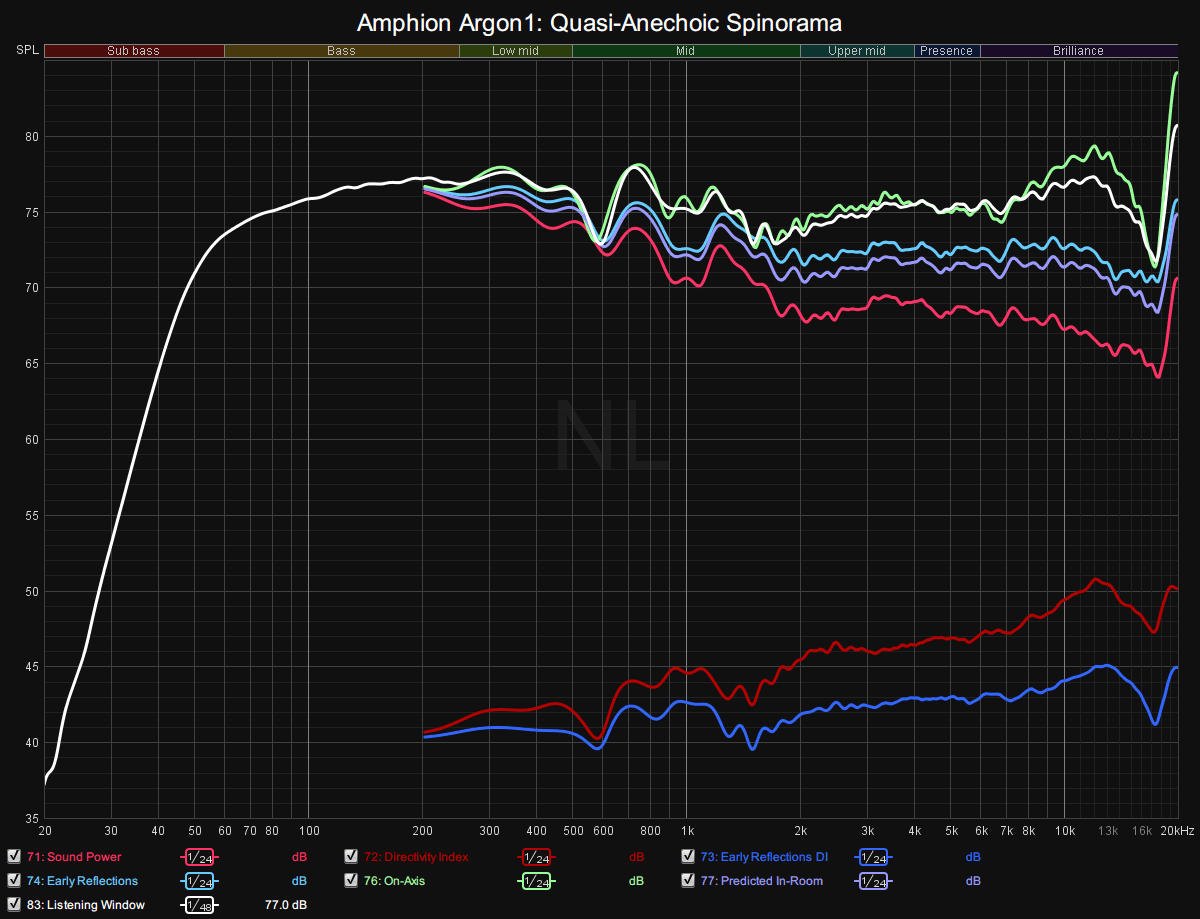
I enjoyed both of those speakers a lot, and they can both get much louder than the Nest Audio due to their larger woofers and cabinets. But within the Nest Audio’s comfortable volume range, if you asked me to tell you which of these two speakers is better based only on the spinorama — again, a great predictor of sound quality — Google might have won out.
It’s not perfect, of course. After 8 kHz, there is a dip — however, you can see this region also rises in the off-axis data, so it balances out to some degree. In any case, music doesn’t tend to have much content above 10 kHz, and older listeners may not be able to hear much in this range. I did not find this dip to be a major issue, and I suspect most listeners won’t either.
You may have also noticed the bass is a bit elevated, but in this case, that isn’t necessarily a bad thing.
Google purposefully changes the bass quantity at different volume levels. This is partly to protect the woofer from distorting too much at very high volumes, but it serves another purpose too. We are proportionately less sensitive to bass at lower volumes, so it helps to have some extra bass when not listening too loud. Here we can see how the response for the woofer changes at different volume percentages:
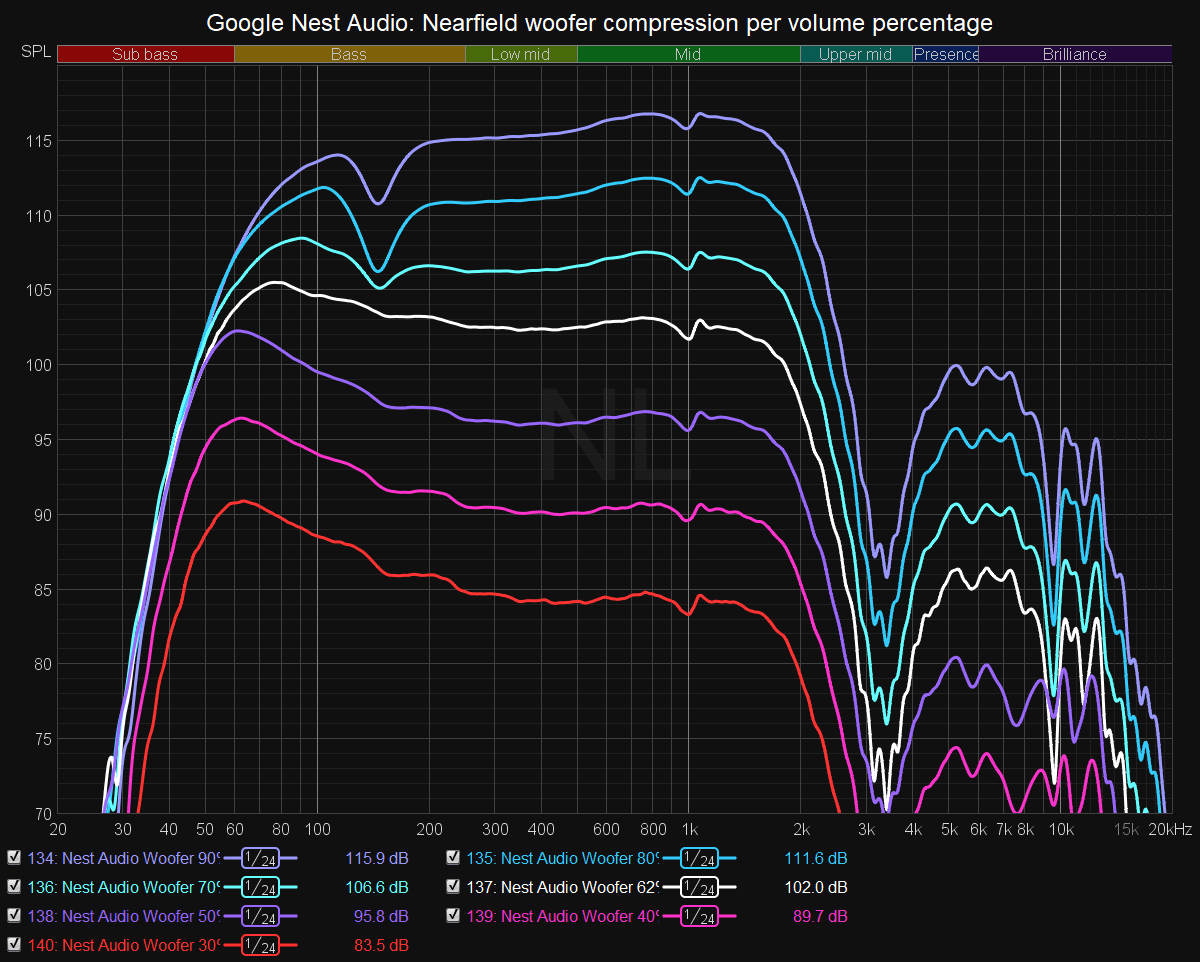
The woofer’s frequency response was captured with the microphone directly against the Nest Audio’s fabric. The top curve is as at 90% percent volume, the bottom curve is at 40%. All of my other measurements were captured at 62% volume.
Though Google is applying some compression to the bass (it doesn’t extend quite as low at the highest volumes), it is relatively subtle, mostly affecting frequencies below 100Hz. Though you can tell the speaker is reaching its low-bass limit once you go past about 80 percent, it maintains surprisingly good dynamics for a speaker this small.
Perhaps more importantly, at typical listening levels, you have useful bass down into the 40 Hz region. That’s remarkable for a speaker this size. It won’t maintain that bass extension at high volumes, but it’s nice of Google to eke out extra performance where it can. For reference, Google rates the speaker as having a max volume of about 86 dB at 1 meter, and a max bass output of 77 dB. That is about in line with my results once you account for my measurement distances.
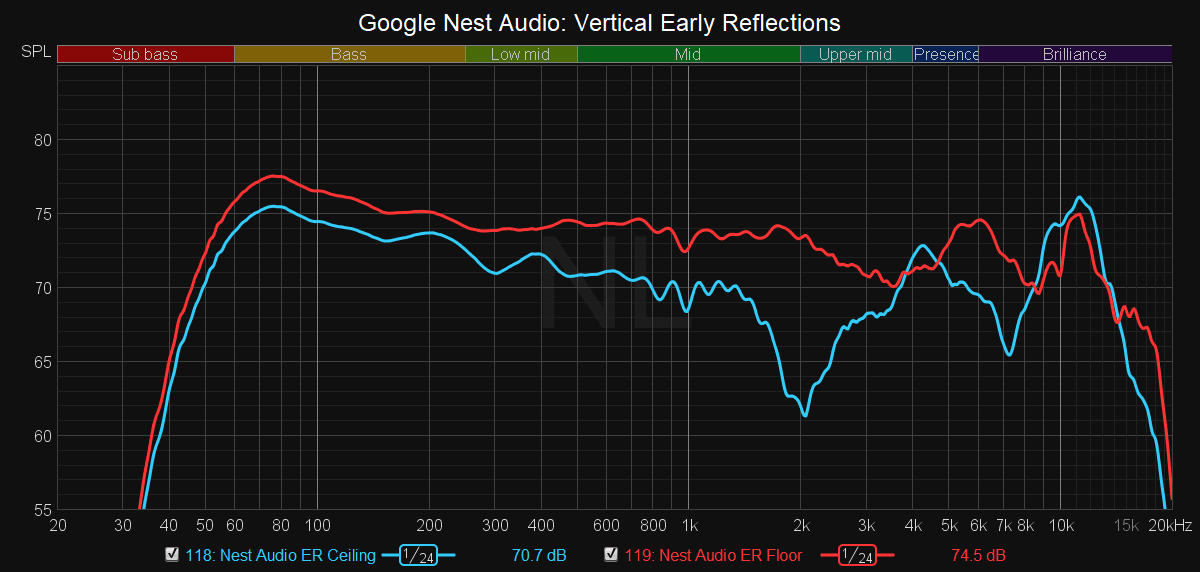
The off-axis curves may be most impressive part of this speaker; the Nest Audio shows some seriously good directivity control that is very rare to find at this price point. We can get a closer look at the soundstage performance by estimating the reflections off the walls in front, behind, and to the sides of the Nest Audio, as well as the total horizontal reflections. Horizontal reflections have a far larger impact on the soundstage than vertical ones do, hence the added emphasis:
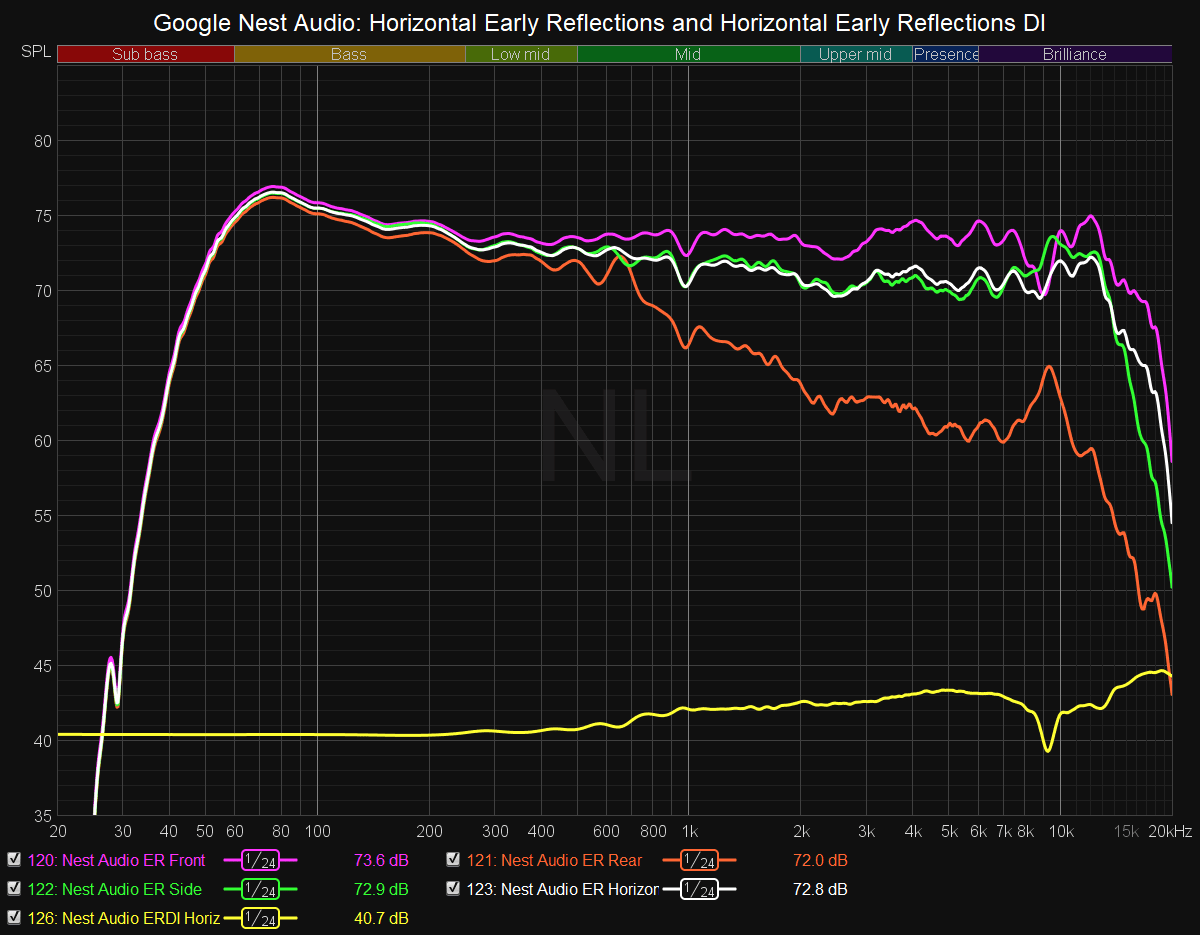
Again, remarkably smooth. The Total Horizontal Reflections curve is particularly flat, and you can see how the on-axis dip is balanced by a rise off-axis. The yellow ‘Horizontal ERDI’ curve indicates how much the horizontal reflections vary from the Listening Window, and you can see this is a smooth curve until the blip at 9 kHz. This is what we want to see to predict good soundstage performance, even when you’re just listening to a single speaker.
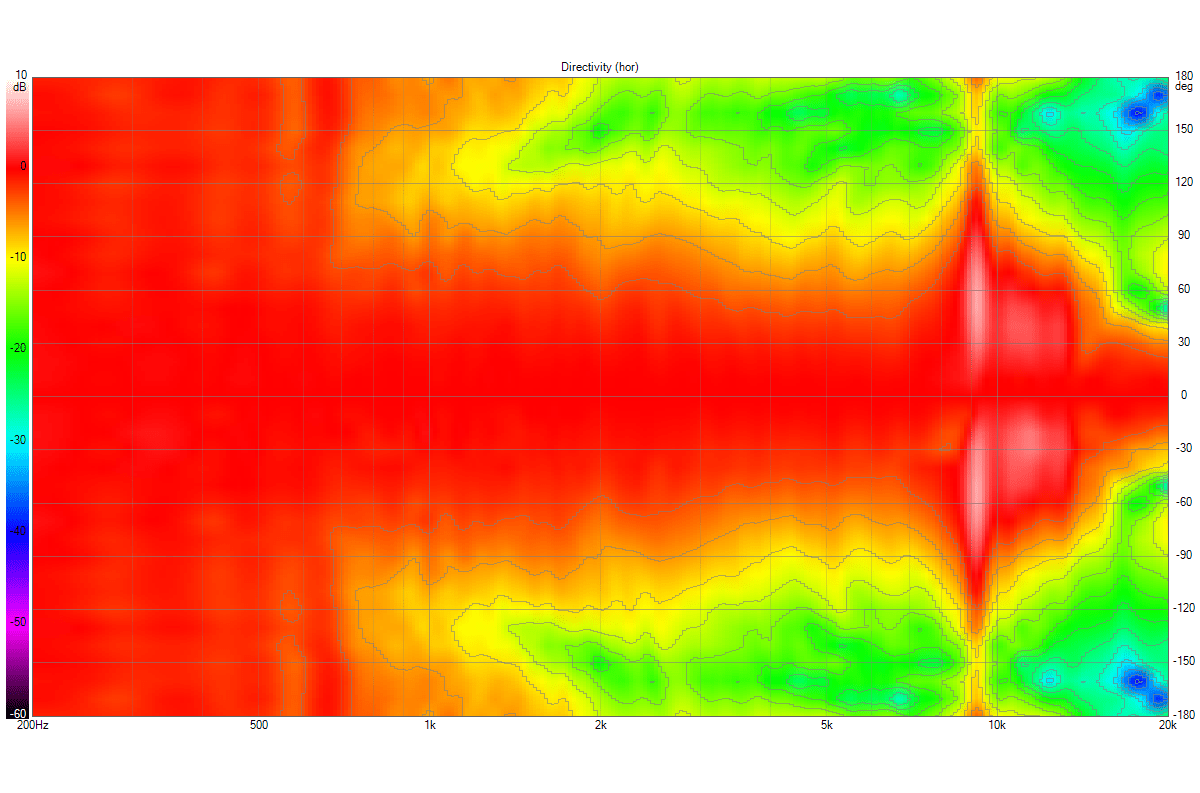
Lastly, we can get even more granular to shows changes in frequency response from 0 to 90 degrees:
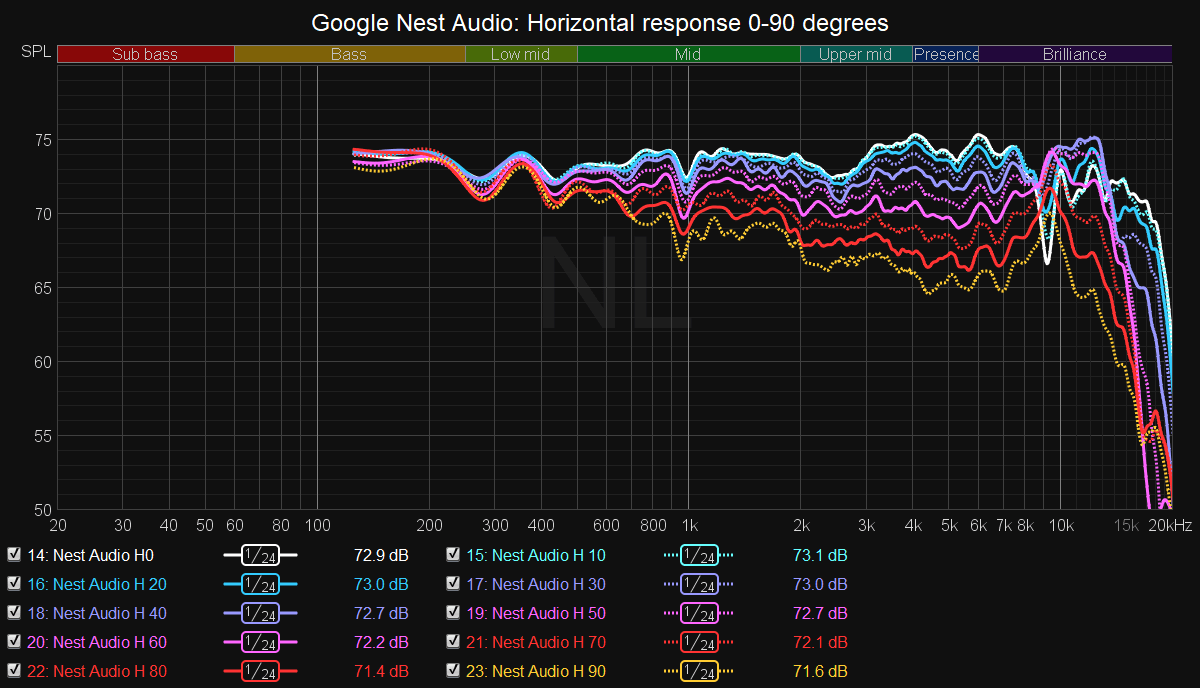
More rainbow spaghetti, but wow. Save for the blip at 9 kHz, which again, probably looks worse than it sounds (our ears are not too sensitive to narrow deviations), the Nest Audio’s frequency response changes extremely smoothly to its sides. Blip aside, this directivity performance wouldn’t be out of place in some studio monitors costing hundreds of dollars more.
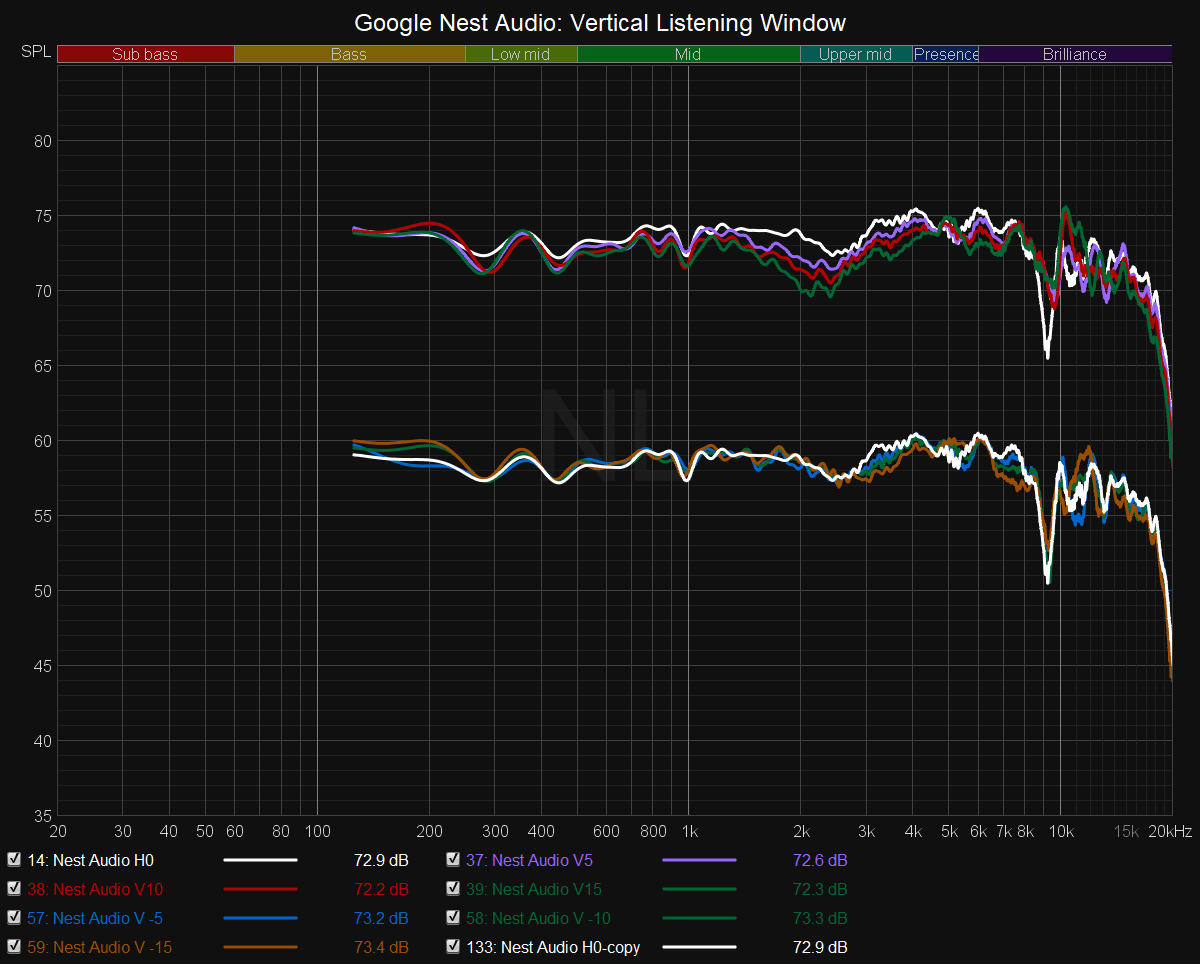
I can go on with more measurements, but I think you get the point: the Nest Audio measures better than a cheap ‘smart’ speaker has any right to. For those interested, the gallery below includes more detail on the speaker’s vertical performance, as well as one more view of the horizontal data.

It’s called the Nest Audio, after all
What I most appreciate about the Nest Audio’s measurement data is that it makes it obvious that the team in charge of tuning the Nest Audio legitimately tried. The ‘Audio’ part of the name was taken seriously, because this kind of measured performance doesn’t happen by accident. The data shows a speaker mostly free of the anomalies that would relegate it to the “only good for background music” category.
The Nest Audio deserves more than to collect dust on your dresser. The performance is good enough that I wish the speakers had a physical input so I could use a pair as my desktop speakers.
No, it won’t get crazy loud, it doesn’t have the same omni-directional tricks as the Apple HomePod, and it doesn’t tune itself to your room like the Google Home Max. I wish Google would come out with a subwoofer, as Amazon did for the Echo, to fill out that last bit of bass (which in turn would help its speakers play louder too). But my overarching impression is that the Nest Audio gets the basics of speaker design right.
To be fair, I haven’t given the same treatment to the plethora of other smart speakers on the market. I was impressed by the Sonos Move back in January, so for all I know, these convenience-oriented speakers have been outperforming audiophile favorites this whole time. I can’t say for sure whether the Nest Audio is better than the Amazon Echos of the world, nor how it compares to Google’s other speakers, without having measured them.
But I can compare the results to what I see from dedicated audio companies. As far as this specific speaker is concerned, it turns out it’s not just the Nest Audio that’s smart — the engineers behind it are pretty smart too. If you at all care about sound quality in your smart speakers, the Nest Audio is a no-brainer for 99 bucks.
Get the TNW newsletter
Get the most important tech news in your inbox each week.