It’s that time of year when humans as well as their pets dress up in Halloween costumes and discussions around trick-or-treating, candy, and of course, paranormal entities take the limelight.
I wanted to get into the proper holiday mood, and we all know nothing does the trick like a good ol’ data analysis and visualization.
The US spends $9 billion each year on this second highest commercial holiday, so I thought it’d be interesting to find out how topics such as haunted places, spirits, and mysterious creatures have been ingrained in various cities — and to find the ‘spookiest city’ in the US!
Aarrrrrgh! Aarrrrrgh! Aarrrrrgh!
That was my poor attempt to set the mood for this spooky study. Now, let’s first understand the data, our goals and then, I’ll move to the visualizations.

The <3 of EU tech
The latest rumblings from the EU tech scene, a story from our wise ol' founder Boris, and some questionable AI art. It's free, every week, in your inbox. Sign up now!
The dataset
The data used for this analysis was extracted from Shadow Lands which has a great index of haunted places. Locations where “ghosts and hauntings” have been witnessed are included in the list and people can report new sightings through the website — which is surely an extremely accurate and scientific method.
I’m looking to get to the bottom of the ‘spookiness’ question for Halloween’s favorite country, the US, so our data set is only focused on the 11,000 haunted places listed in the US, which all include the following data fields:
- Location
- City
- State name
- Description of the place
- City’s latitude
- City’s longitude
Goals
So, what exactly are we planning to uncover? Check out the following to understand:
- Top 30 spookiest cities
- Spookiest states based on the number of haunted places
- Heatmap of the US based on coordinates
- Frequently used terms in the description text
- Relationship between words
Let’s get cracking then.
Top 30 spookiest cities
Out of 4,356 cities listed on the site, Los Angeles, San Antonio, and Honolulu are the ones that have the highest number of haunted places. I used the ‘city’ data field present in the data set to arrive at the number of occurrences and created the chart given below to show the top 30 cities.
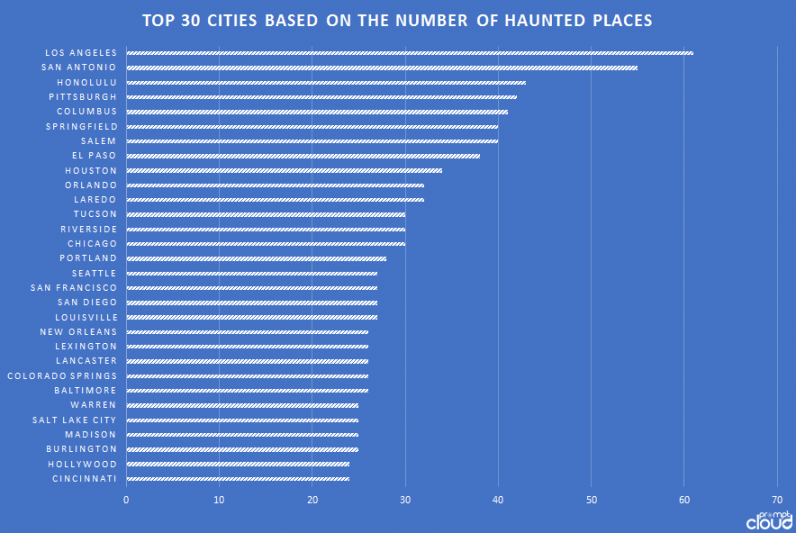
Coming back to LA, the following locations have the most number of references: ‘Boyle Heights’, ‘Loyola Marymount University’, and ‘Occidental College’. Specifically, Hollywood has 25 references and Universal Studio features twice in this list. So be careful out there.
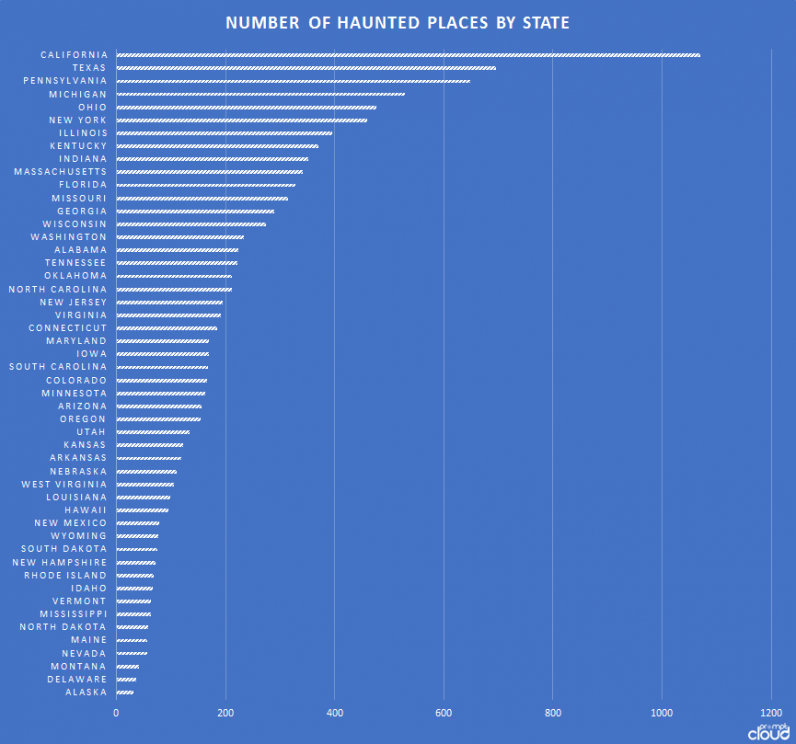
Most haunted states
Let’s now find out the number of haunted places for each state. The chart given below shows that California, Texas, and Pennsylvania are the states with the most number of haunted places.
If you’re afraid of ghosts, then you might want to move to Montana, Delaware, or Alaska as they are the least haunted states in the US.
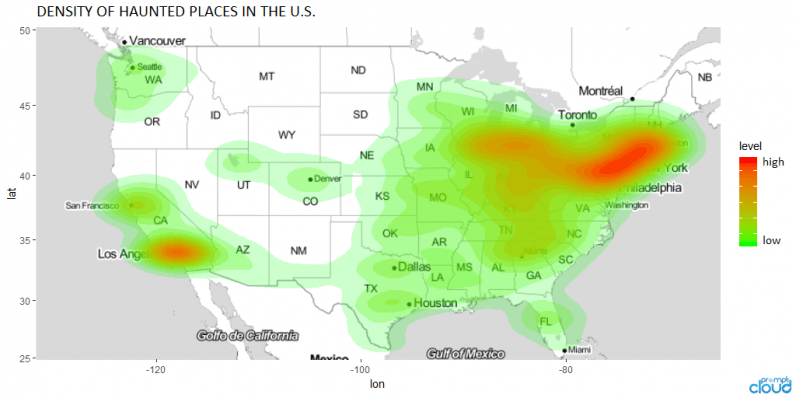
Heatmap of haunted places
We have already found out the ’spookiness’ of the states and cities based on the number of haunted places (which is of course 100 percent factual and based on years of scientific research).
However, visualizing the data on a map adds further clarity. So, in this section I’ll create a heatmap of the United States by using the latitude and longitude data in conjunction with the count of the haunted places.
Oh wow, this is really scary.
Clearly the East Coast is more haunted than the West Coast and the Southern US is more haunted than the Northwestern US. On the West Coast, only Los Angeles, San Francisco, and Seattle are comparatively spooky — looks like most ghost are former tech entrepreneurs.
Now it’s clear where spooky things happens, but how is it spooky?
Frequently used terms in the description
In this section I want to find out the most frequently used words present in the description text of the dataset. I used text mining techniques available in R (programming language for statistical computing and graphics) to create the following word cloud which shows the top 300 terms.

It is evident that words such as ‘night’, ‘people’, ‘old’, ‘see’, ‘house’, ‘ghost’, ‘room’, ‘building’, ‘room’, etc. are prevalent. Some of the interesting elements are the following:
- It seems the chance of encountering mysterious beings is higher in house, building, and road in comparison to cemetery. TIL
- The cumulative word count for female (women/girls/lady) is higher than male (men/boys).
- Word count for ‘old’ is higher than ‘young’ — but I still fear teenagers
- Vampires outnumber werewolves in terms of word count — which hopefully will finally settle the heated Team Edward/Team Jacob debate
Relationship between words in the description
Although we figured out the frequently used words, it’d be much more insightful if we could find out the relationship between the words used in the description texts. I’ll take the help of tidy data framework for text mining via R to produce the visualization.
Here we will focus on bi-grams (a pair of consecutive written units) and visualize the relationship via network graph. Bi-grams are particularly interesting since they allow analysis of sequence of words and their underlying connections.
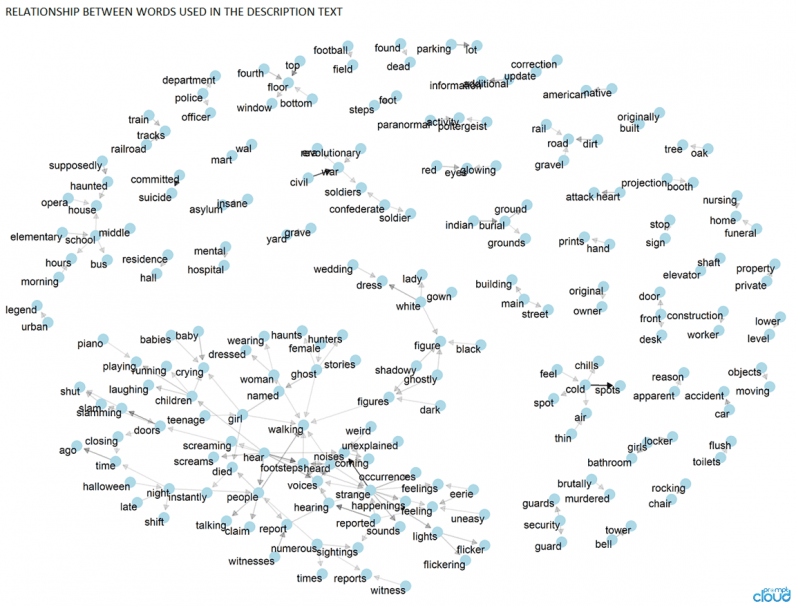
This network graph shows some interesting connections. For instance, there’s a cluster of words related to soldiers and civil war. This means there are bunch of haunted places that have originated from the mayhem and death caused by civil war. Close by are the words ‘wal’ and ‘mart’ — I wonder what they mean…
The larger cluster at the bottom associates ghost with haunt, hunters, and stories (what a surprise). We also see words such as shadowy, ghostly, and dark are associated with figures, which is connected to walking.
Interesting to note that at the top the word poltergeist (noisy ghost) is associated with paranormal activity. This makes sense because apparently they are capable of pinching, biting, hitting, and tripping people. Poltergeists are also associated with levitation of objects which definitely counts as paranormal activity.
Conclusion
This sums up our little Halloween voyage via data visualization. I don’t know about you, but this was just the thing I needed to get into the holiday mood.
We saw that California is the spookiest state which houses the spookiest city, i.e., Los Angeles. Apart from that we uncovered the frequently used words and their underlying connections. Now it’s time for you to carve a pumpkin and study this article intensely for your Halloween party talking-points!
Get the TNW newsletter
Get the most important tech news in your inbox each week.