
Google has just launched Databoard, a new tool which lets you explore industry research and share it with friends and co-workers.
The tool, which is targeted towards small businesses, is a curious move on Google’s part, because it currently does little more than feature research conducted by Google itself.
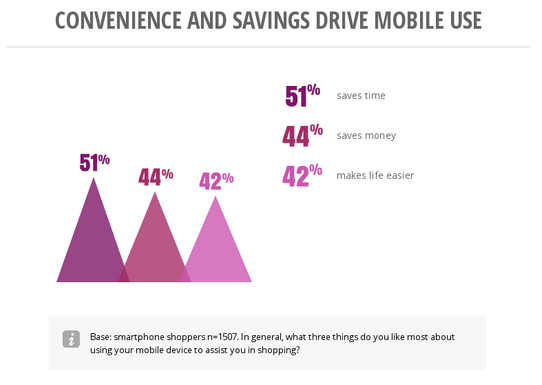
As for the research, it’s centered around smartphone usage and mobile shopping and is presented in a rather attractive way, but focuses almost entirely on data that highlights why Google thinks its business model is awesome.
Beyond discovering little quotes that say mobile shoppers spend more money, Google’s Databoard lets you build your own infographics. Here’s one I created, a snippet of which is pictured below.

The <3 of EU tech
The latest rumblings from the EU tech scene, a story from our wise ol' founder Boris, and some questionable AI art. It's free, every week, in your inbox. Sign up now!
With just six research studies available to pull from, the infographic creator is extremely short on content at the moment. The data itself is equally unexciting.
Google says, however, that additional studies “will be added frequently.” If these studies expand to a wide variety of data sets and verticals, Databoard could shift from a PR tool to a highly interesting research product. Especially for a company determined to thrive in education, this could pan out in a big way, but until then, it’s very underwhelming.
Get the TNW newsletter
Get the most important tech news in your inbox each week.