
Google updated its Platform Versions Web page for Android on Tuesday, and there are big changes afoot, though it’s mainly due to the fact that the company has changed how it counts users. Android 4.2 (Jelly Bean) and Android 4.1 (Jelly Bean) are still growing and have passed the 25 percent mark, Android 4.0 (Ice Cream Sandwich) is slightly back up, but still below the 30 percent mark, and arguably most importantly, Android 2.3 (Gingerbread) is now on less than 40 percent of devices.
If you’ve been following our coverage of these numbers, however, you’ll note that these are huge movements, especially for Jelly Bean. Yet the reason is not because of an upsurge in sales, but rather because Google has tweaked its algorithm.
In its own words, the company explains:
Note: Beginning in April, 2013, these charts are now built using data collected from each device when the user visits the Google Play Store. Previously, the data was collected when the device simply checked-in to Google servers. We believe the new data more accurately reflects those users who are most engaged in the Android and Google Play ecosystem.
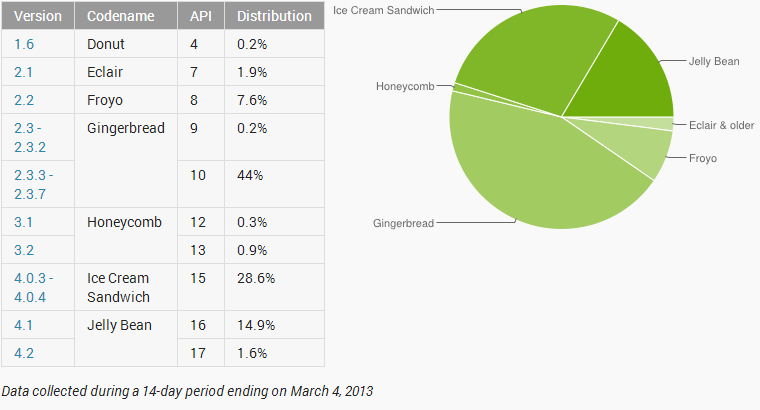
For the sake of comparison, let’s look at how things looked like last month:
Now here’s this month’s data:
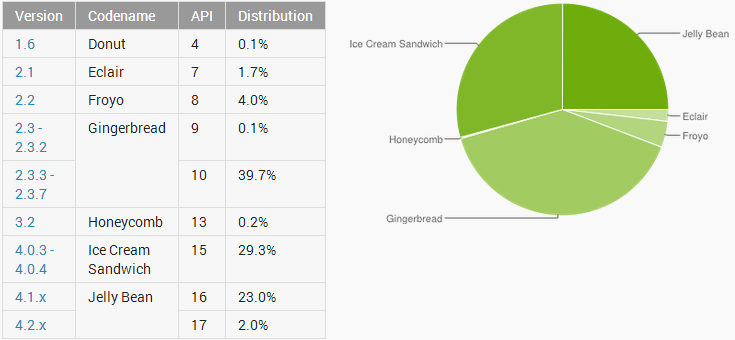
Breaking down the numbers more specifically, 25.0 percent of Android users are using Jelly Bean, 29.3 percent have devices powered by ICS, 0.2 percent are on Honeycomb, 39.8 are stuck with Gingerbread, and 4.0 percent unfortunately still have Froyo.
Compared to the previous data we have, Android has suddenly made huge progress. Android 4.2 has gained a minute 0.4 percentage points (from 1.6 percent to 2.0 percent) while Android 4.1 has gained a huge 8.1 percent (from 14.9 percent to 23.0 percent). Android 4.0 has grabbed another 0.7 points (from 28.6 percent to 29.3 percent). In other words, all the new versions gained share.
The old versions, however dropped quite a bit. Android 3.0 dipped 1.0 percent (from 1.2 percent to 0.2 percent), Android 2.3 dropped a solid 4.4 points (from 44.2 percent to 39.8 percent), and Android 2.2 fell 3.6 points (from 7.6 percent to 4.0 percent).
Despite these drastic movements, the bigger picture remains unchanged: Gingerbread (released December 2010) is first, ICS (October 2011) is second, the latest and greatest Jelly Beans (June 2012 and November 2012) are third, and Froyo (May 2010) is fourth.
So did Google do the right thing by changing its metrics? Yes and no. The bad news is that it skews the data to give an inaccurate picture of which versions are being used. The good news is that it skews the data favorably for developers who want to target users that are actively using Google Play.
Previously, anytime your device checked the store, it would be counted. Now, Google counts every time a user purposefully visits the store. Given that this data is aimed to help developers, it ultimately will come down to how they see it: if they end up building more and better apps using newer APIs, then they, and users on later versions of Android, gain. Otherwise, Google will just be throwing numbers around.
Top Image credit: Chris Denham
Get the TNW newsletter
Get the most important tech news in your inbox each week.